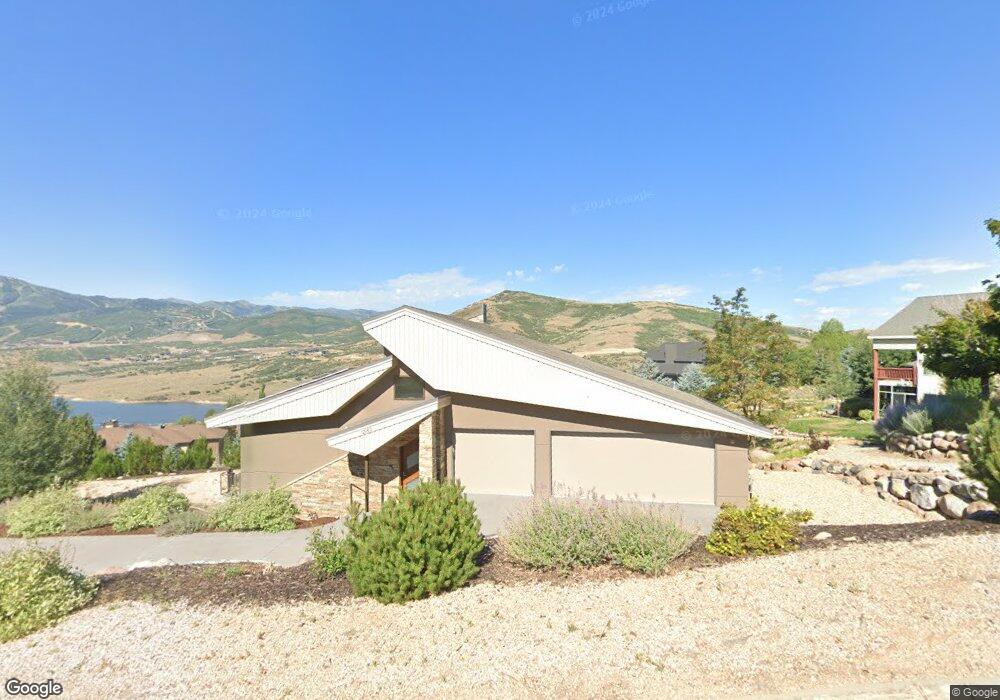
12183 Bone Hollow Rd Unit 63 Hideout, UT 84036
Estimated Value: $2,990,571
--
Bed
--
Bath
2,700
Sq Ft
$1,108/Sq Ft
Est. Value
About This Home
This home is located at 12183 Bone Hollow Rd Unit 63, Hideout, UT 84036 and is currently estimated at $2,990,571, approximately $1,107 per square foot. 12183 Bone Hollow Rd Unit 63 is a home located in Wasatch County with nearby schools including Midway Elementary School, Rocky Mountain Middle School, and Wasatch High School.
Ownership History
Date
Name
Owned For
Owner Type
Purchase Details
Closed on
Feb 8, 2021
Sold by
Harden Ted and Harden Emily
Bought by
Hornish Thomas E and Hornish Suzanne J
Current Estimated Value
Home Financials for this Owner
Home Financials are based on the most recent Mortgage that was taken out on this home.
Original Mortgage
$1,979,780
Outstanding Balance
$1,772,221
Interest Rate
2.75%
Mortgage Type
New Conventional
Estimated Equity
$1,218,350
Purchase Details
Closed on
May 30, 2019
Sold by
Zealy Jonathon and Barker Smith Liza Claire
Bought by
Harden Ted and Harden Emily
Home Financials for this Owner
Home Financials are based on the most recent Mortgage that was taken out on this home.
Original Mortgage
$700,000
Interest Rate
4.1%
Mortgage Type
Future Advance Clause Open End Mortgage
Purchase Details
Closed on
Oct 7, 2012
Sold by
Joy William Edward and Joy Jane
Bought by
Zealey Jonathon and Barker Smith Liza Claire
Create a Home Valuation Report for This Property
The Home Valuation Report is an in-depth analysis detailing your home's value as well as a comparison with similar homes in the area
Home Values in the Area
Average Home Value in this Area
Purchase History
| Date | Buyer | Sale Price | Title Company |
|---|---|---|---|
| Hornish Thomas E | -- | Real Advantage Ttl Ins Agcy | |
| Harden Ted | -- | Real Advantage Ttl Ins Agcy | |
| Zealey Jonathon | -- | Park City Title Company |
Source: Public Records
Mortgage History
| Date | Status | Borrower | Loan Amount |
|---|---|---|---|
| Open | Hornish Thomas E | $1,979,780 | |
| Previous Owner | Harden Ted | $700,000 |
Source: Public Records
Tax History Compared to Growth
Tax History
| Year | Tax Paid | Tax Assessment Tax Assessment Total Assessment is a certain percentage of the fair market value that is determined by local assessors to be the total taxable value of land and additions on the property. | Land | Improvement |
|---|---|---|---|---|
| 2025 | $8,228 | $2,536,225 | $470,600 | $2,065,625 |
| 2024 | $8,228 | $1,947,760 | $350,000 | $1,597,760 |
| 2023 | $8,228 | $1,780,385 | $395,000 | $1,385,385 |
| 2022 | $6,879 | $1,341,640 | $175,000 | $1,166,640 |
| 2021 | $8,634 | $1,341,640 | $175,000 | $1,166,640 |
| 2020 | $6,449 | $971,742 | $175,000 | $796,742 |
| 2019 | $6,012 | $534,458 | $0 | $0 |
| 2018 | $5,564 | $494,621 | $0 | $0 |
| 2017 | $5,557 | $494,621 | $0 | $0 |
| 2016 | $5,668 | $494,621 | $0 | $0 |
| 2015 | $5,338 | $494,621 | $0 | $0 |
| 2014 | $1,396 | $475,017 | $175,000 | $300,017 |
Source: Public Records
Map
Nearby Homes
- 198 E Keetly Close Cir
- 12068 N Sage Hollow Cir
- 12068 N Sage Hollow Cir Unit 20
- 12403 Ross Creek Dr
- 12472 Ross Creek Dr
- 368 W Ascent Dr
- 337 E Overlook Loop Unit 23
- 363 E Overlook Loop Unit 22
- 363 E Overlook Loop
- Uphill Estate Acacia B Plan at Lakeview Estates - Uphill Estate Acacia
- Uphill Estate Acacia A Plan at Lakeview Estates - Uphill Estate Acacia
- Sundance A Plan at Deer Waters Resort - Townhomes
- Uphill Estate Tupelo B Plan at Lakeview Estates - Uphill Estate Tupelo
- Downhill Estate Oak A Plan at Lakeview Estates - Downhill Estate Oak
- Uphill Estate Willow A Plan at Lakeview Estates - Uphill Estate Willow
- Downhill Estate Maple B Plan at Lakeview Estates - Downhill Estate Maple
- Uphill Estate Willow B Plan at Lakeview Estates - Uphill Estate Willow
- Downhill Estate Oak B Plan at Lakeview Estates - Downhill Estate Oak
- Uphill Estate Tupelo A Plan at Lakeview Estates - Uphill Estate Tupelo
- Downhill Estate Pine B Plan at Lakeview Estates - Downhill Estate Pine
- 12183 Bone Hollow Rd
- 12183 Bone Hollow Rd
- 12230 Bone Hollow Rd
- 12230 Bone Hollow Rd
- 12230 Bone Hollow Rd Unit 40
- 340 Big Dutch Dr
- 340 E Big Dutch Dr
- 12285 Bone Hollow Rd
- 12285 N Bone Hollow Rd
- 12344 N Deer Mountain Blvd
- 12328 N Deer Mountain Blvd
- 12328 N Deer Mountain Blvd
- 12230 N Bone Hollow Rd
- 337 Big Dutch Dr
- 12296 N Bone Hollow Rd
- 337 E Big Dutch Dr
- 354 E Big Dutch Dr
- 12298 N Bone Hollow Rd
- 12347 Bone Hollow Rd
- 12314 N Deer Mountain Blvd