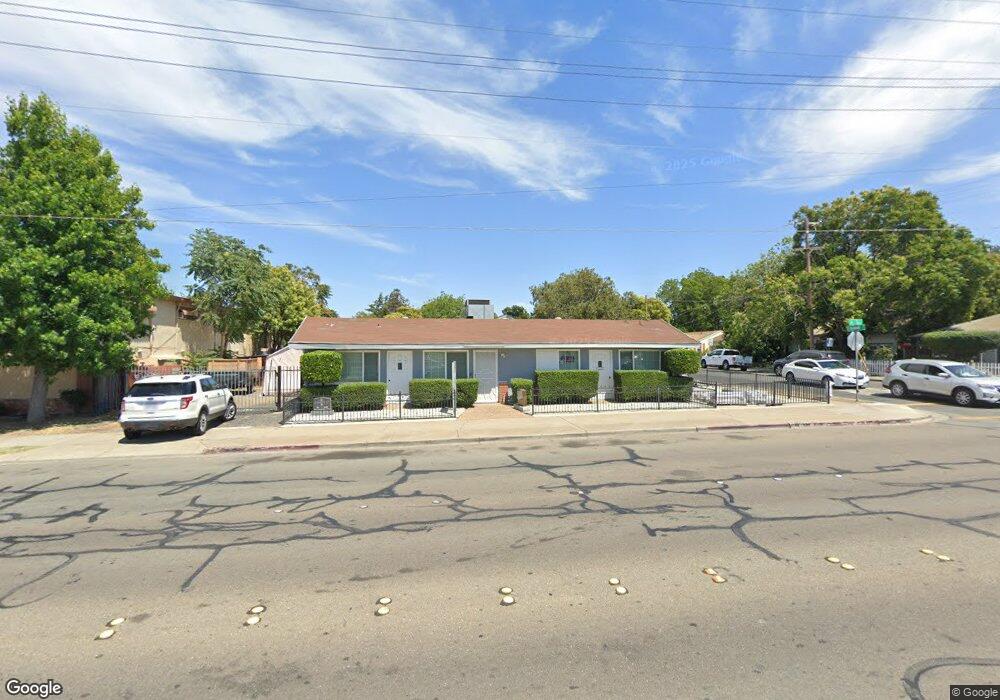
1219 A St Antioch, CA 94509
North Antioch NeighborhoodEstimated Value: $207,844
Studio
--
Bath
1,100
Sq Ft
$189/Sq Ft
Est. Value
About This Home
This home is located at 1219 A St, Antioch, CA 94509 and is currently estimated at $207,844, approximately $188 per square foot. 1219 A St is a home located in Contra Costa County with nearby schools including Kimball Elementary School, Antioch Middle School, and Antioch High School.
Ownership History
Date
Name
Owned For
Owner Type
Purchase Details
Closed on
Oct 16, 2014
Sold by
Martin Jimmie Mcarthur
Bought by
Martin Jimmie M
Current Estimated Value
Purchase Details
Closed on
Mar 21, 2014
Sold by
Heaton Robert L
Bought by
Martin Jimmie Mcarthur
Purchase Details
Closed on
Oct 24, 2011
Sold by
Heaton Robert L
Bought by
Heaton Robert L
Purchase Details
Closed on
Jun 25, 2007
Sold by
Heaton Olivia V
Bought by
Heaton Robert L
Purchase Details
Closed on
Jun 24, 1996
Sold by
Heaton Denise Michelle
Bought by
Heaton Robert
Create a Home Valuation Report for This Property
The Home Valuation Report is an in-depth analysis detailing your home's value as well as a comparison with similar homes in the area
Home Values in the Area
Average Home Value in this Area
Purchase History
| Date | Buyer | Sale Price | Title Company |
|---|---|---|---|
| Martin Jimmie M | -- | None Available | |
| Martin Jimmie Mcarthur | $120,000 | Fidelity National Title Co | |
| Heaton Robert L | -- | None Available | |
| Heaton Robert L | -- | None Available | |
| Heaton Robert | -- | Chicago Title Co |
Source: Public Records
Tax History
| Year | Tax Paid | Tax Assessment Tax Assessment Total Assessment is a certain percentage of the fair market value that is determined by local assessors to be the total taxable value of land and additions on the property. | Land | Improvement |
|---|---|---|---|---|
| 2025 | $2,204 | $147,091 | $92,669 | $54,422 |
| 2024 | $2,066 | $144,207 | $90,852 | $53,355 |
| 2023 | $2,066 | $141,380 | $89,071 | $52,309 |
| 2022 | $2,039 | $138,609 | $87,325 | $51,284 |
| 2021 | $1,963 | $135,892 | $85,613 | $50,279 |
| 2019 | $2,011 | $131,864 | $83,075 | $48,789 |
| 2018 | $1,943 | $129,280 | $81,447 | $47,833 |
| 2017 | $1,890 | $126,746 | $79,850 | $46,896 |
| 2016 | $1,836 | $124,262 | $78,285 | $45,977 |
| 2015 | $1,811 | $122,397 | $77,110 | $45,287 |
| 2014 | $1,308 | $79,941 | $47,970 | $31,971 |
Source: Public Records
Map
Nearby Homes
Your Personal Tour Guide
Ask me questions while you tour the home.