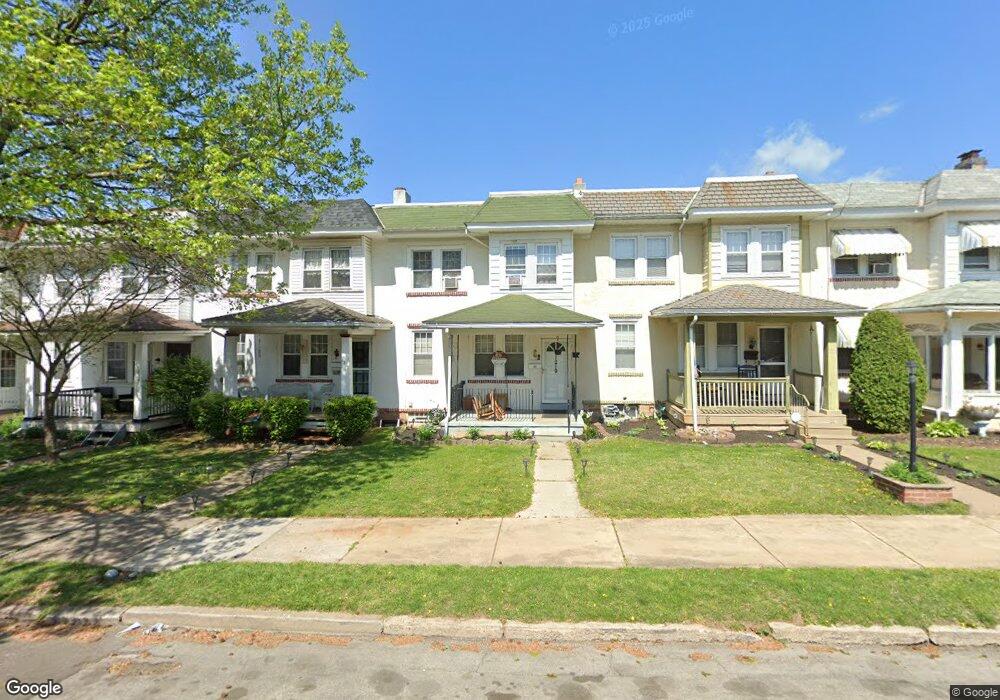
1219 Astor St Norristown, PA 19401
Estimated Value: $227,000 - $254,773
3
Beds
1
Bath
1,360
Sq Ft
$180/Sq Ft
Est. Value
About This Home
This home is located at 1219 Astor St, Norristown, PA 19401 and is currently estimated at $244,943, approximately $180 per square foot. 1219 Astor St is a home located in Montgomery County with nearby schools including Hancock Elementary School, Charles Blockson Middle School, and East Norriton Middle School.
Ownership History
Date
Name
Owned For
Owner Type
Purchase Details
Closed on
Dec 22, 2011
Sold by
Greenwood John R
Bought by
Borbonio Julissa
Current Estimated Value
Home Financials for this Owner
Home Financials are based on the most recent Mortgage that was taken out on this home.
Original Mortgage
$6,098
Outstanding Balance
$4,181
Interest Rate
3.98%
Estimated Equity
$240,762
Purchase Details
Closed on
Aug 1, 2011
Sold by
Long William M and Long Diane D
Bought by
Greenwood John R
Purchase Details
Closed on
Dec 17, 2002
Sold by
Yocom Kathleen R
Bought by
Long William M and Long Diane D
Create a Home Valuation Report for This Property
The Home Valuation Report is an in-depth analysis detailing your home's value as well as a comparison with similar homes in the area
Home Values in the Area
Average Home Value in this Area
Purchase History
| Date | Buyer | Sale Price | Title Company |
|---|---|---|---|
| Borbonio Julissa | $119,900 | None Available | |
| Greenwood John R | $55,000 | None Available | |
| Long William M | $92,500 | -- |
Source: Public Records
Mortgage History
| Date | Status | Borrower | Loan Amount |
|---|---|---|---|
| Open | Borbonio Julissa | $6,098 | |
| Open | Borbonio Julissa | $116,860 |
Source: Public Records
Tax History Compared to Growth
Tax History
| Year | Tax Paid | Tax Assessment Tax Assessment Total Assessment is a certain percentage of the fair market value that is determined by local assessors to be the total taxable value of land and additions on the property. | Land | Improvement |
|---|---|---|---|---|
| 2025 | $5,417 | $88,250 | $21,950 | $66,300 |
| 2024 | $5,417 | $88,250 | $21,950 | $66,300 |
| 2023 | $5,368 | $88,250 | $21,950 | $66,300 |
| 2022 | $5,252 | $88,250 | $21,950 | $66,300 |
| 2021 | $5,227 | $88,250 | $21,950 | $66,300 |
| 2020 | $4,986 | $88,250 | $21,950 | $66,300 |
| 2019 | $4,895 | $88,250 | $21,950 | $66,300 |
| 2018 | $3,011 | $88,250 | $21,950 | $66,300 |
| 2017 | $4,495 | $88,250 | $21,950 | $66,300 |
| 2016 | $4,461 | $88,250 | $21,950 | $66,300 |
| 2015 | $4,273 | $88,250 | $21,950 | $66,300 |
| 2014 | $4,273 | $88,250 | $21,950 | $66,300 |
Source: Public Records
Map
Nearby Homes