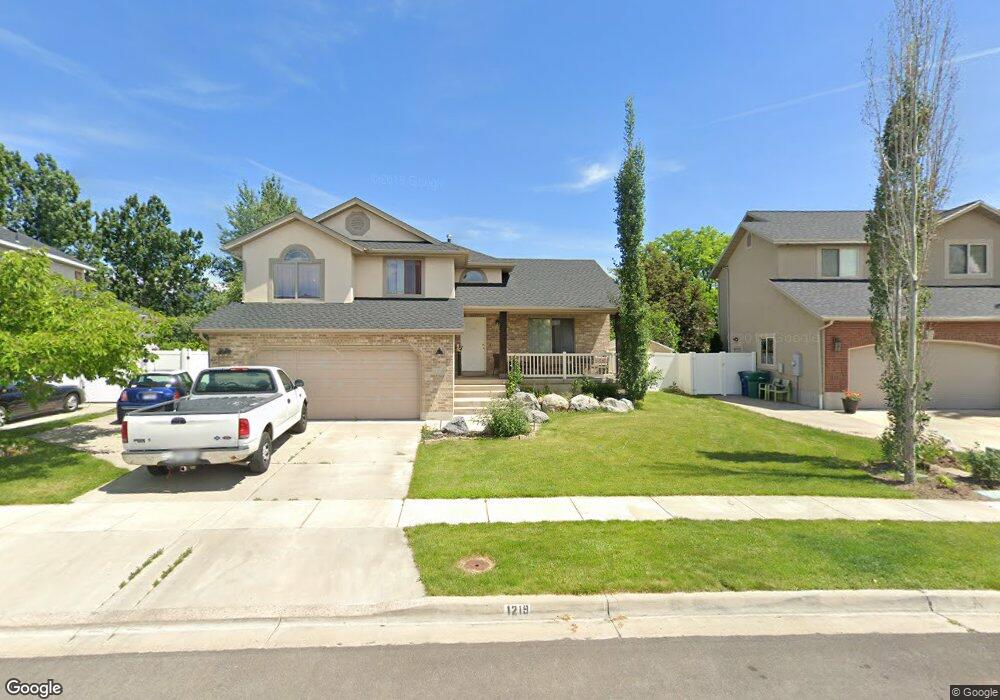
1219 Bridge Park Way Unit 408 Layton, UT 84041
Estimated Value: $555,000 - $613,000
3
Beds
3
Baths
1,755
Sq Ft
$336/Sq Ft
Est. Value
About This Home
This home is located at 1219 Bridge Park Way Unit 408, Layton, UT 84041 and is currently estimated at $589,572, approximately $335 per square foot. 1219 Bridge Park Way Unit 408 is a home located in Davis County with nearby schools including Heritage Elementary School, Shoreline Junior High School, and Davis High School.
Ownership History
Date
Name
Owned For
Owner Type
Purchase Details
Closed on
Apr 2, 2003
Sold by
Grant James W and Grant Rachelle T
Bought by
Heslop Andrew P and Heslop Brenda J
Current Estimated Value
Home Financials for this Owner
Home Financials are based on the most recent Mortgage that was taken out on this home.
Original Mortgage
$175,270
Outstanding Balance
$66,349
Interest Rate
4.25%
Estimated Equity
$523,223
Purchase Details
Closed on
Nov 13, 2000
Sold by
Terraventure Properties Ltd
Bought by
Grant James W and Grant Rachelle T
Home Financials for this Owner
Home Financials are based on the most recent Mortgage that was taken out on this home.
Original Mortgage
$156,700
Interest Rate
7.82%
Purchase Details
Closed on
May 31, 2000
Sold by
Advantage Communities Inc
Bought by
Terra Venture Properties Ltd
Create a Home Valuation Report for This Property
The Home Valuation Report is an in-depth analysis detailing your home's value as well as a comparison with similar homes in the area
Home Values in the Area
Average Home Value in this Area
Purchase History
| Date | Buyer | Sale Price | Title Company |
|---|---|---|---|
| Heslop Andrew P | -- | First American Title Co | |
| Heslop Andrew P | -- | First American Title Co | |
| Grant James W | -- | Backman Stewart Title Servic | |
| Grant James W | -- | Backman Stewart Title Servic | |
| Terra Venture Properties Ltd | -- | Associated Title Company | |
| Terra Venture Properties Ltd | -- | Associated Title Company |
Source: Public Records
Mortgage History
| Date | Status | Borrower | Loan Amount |
|---|---|---|---|
| Open | Heslop Andrew P | $175,270 | |
| Previous Owner | Grant James W | $156,700 |
Source: Public Records
Tax History Compared to Growth
Tax History
| Year | Tax Paid | Tax Assessment Tax Assessment Total Assessment is a certain percentage of the fair market value that is determined by local assessors to be the total taxable value of land and additions on the property. | Land | Improvement |
|---|---|---|---|---|
| 2025 | $2,667 | $279,950 | $145,082 | $134,868 |
| 2024 | $2,601 | $275,000 | $152,600 | $122,400 |
| 2023 | $2,575 | $480,000 | $167,202 | $312,798 |
| 2022 | $2,766 | $279,950 | $93,677 | $186,273 |
| 2021 | $2,617 | $395,000 | $140,467 | $254,533 |
| 2020 | $2,348 | $340,000 | $121,021 | $218,979 |
| 2019 | $2,425 | $344,000 | $117,179 | $226,821 |
| 2018 | $2,219 | $316,000 | $103,534 | $212,466 |
| 2016 | $1,968 | $144,540 | $44,303 | $100,237 |
| 2015 | $1,965 | $137,060 | $44,303 | $92,757 |
| 2014 | $1,996 | $137,500 | $44,303 | $93,197 |
| 2013 | -- | $116,765 | $31,413 | $85,352 |
Source: Public Records
Map
Nearby Homes
- Creighton Farmhouse Plan at Angel Hill
- 2056 W Phillips St
- 1038 S Old Towne Rd
- 1494 S Mica Ln
- Aspen Plan at West Gate
- Eleanor Plan at West Gate
- McKinley Plan at West Gate
- Harrison Plan at West Gate
- Redwood Plan at West Gate
- Alpine - WG Plan at West Gate
- Cottonwood Plan at West Gate
- Linden Plan at West Gate
- Columbia Plan at West Gate
- Roosevelt Plan at West Gate
- Yukon Plan at West Gate
- Spruce Pantry Plan at West Gate
- Sequoia Plan at West Gate
- Basswood Plan at West Gate
- Madison Plan at West Gate
- Charles Plan at West Gate
- 1219 Bridge Park Way
- 1227 Bridge Park Way Unit 409
- 1215 Bridge Park Way
- 1227 Bridge Park Way
- 1211 W Bridge Park
- 1220 Bridge Park Way Unit 428
- 1211 Bridge Park Way
- 1228 Bridge Park Way
- 1228 W Bridge Park
- 1220 Bridge Park Way
- 2194 Lloydwood Dr
- 1243 W Bridge Park Unit 410
- 1249 W Bridge Park Unit 411
- 1243 W Bridge Park
- 2194 Lloydwood Dr Unit 16
- 1243 Bridge Park Way
- 1251 Larchmont Way
- 2206 Lloydwood Dr Unit 17
- 1205 Bridge Park
- 2182 Lloydwood Dr Unit 15