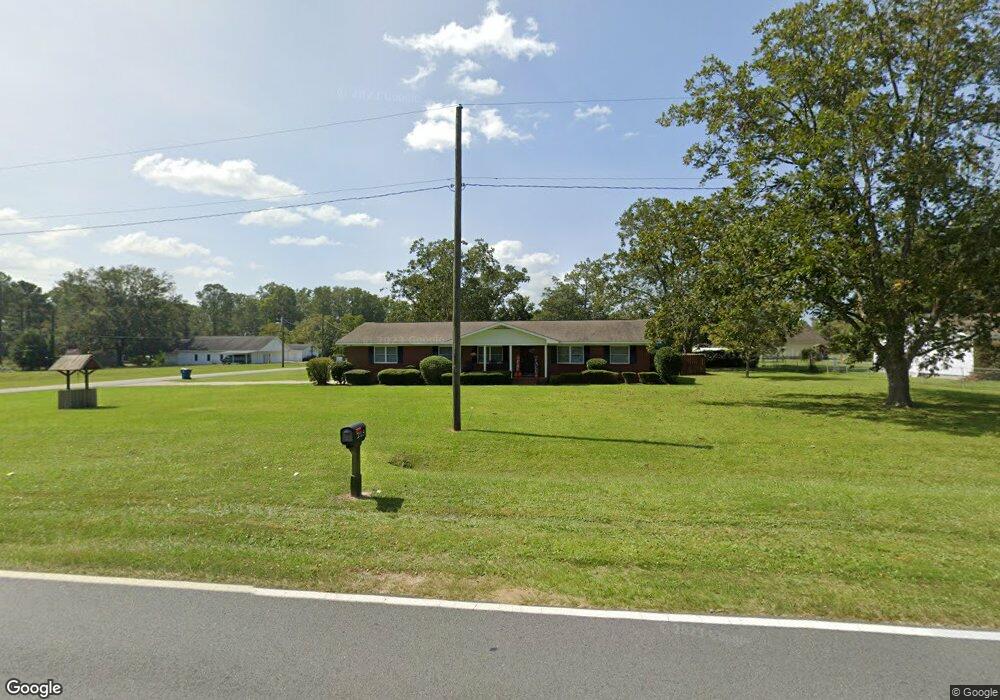
1219 Gorman Rd Waycross, GA 31503
Estimated Value: $247,236 - $315,000
4
Beds
2
Baths
2,164
Sq Ft
$132/Sq Ft
Est. Value
About This Home
This home is located at 1219 Gorman Rd, Waycross, GA 31503 and is currently estimated at $284,809, approximately $131 per square foot. 1219 Gorman Rd is a home located in Ware County with nearby schools including Waresboro Elementary School, Ware County Middle School, and Ware County High School.
Ownership History
Date
Name
Owned For
Owner Type
Purchase Details
Closed on
Oct 16, 2020
Sold by
Andrews John R
Bought by
Heard Shonair
Current Estimated Value
Home Financials for this Owner
Home Financials are based on the most recent Mortgage that was taken out on this home.
Original Mortgage
$166,155
Outstanding Balance
$147,517
Interest Rate
2.8%
Mortgage Type
New Conventional
Estimated Equity
$137,292
Purchase Details
Closed on
Oct 25, 2017
Sold by
Welch William R
Bought by
Andrews John R and Andrews Lisa
Home Financials for this Owner
Home Financials are based on the most recent Mortgage that was taken out on this home.
Original Mortgage
$140,600
Interest Rate
3.83%
Mortgage Type
New Conventional
Purchase Details
Closed on
Jan 15, 2016
Sold by
Blount James Edward
Bought by
Welch William R
Home Financials for this Owner
Home Financials are based on the most recent Mortgage that was taken out on this home.
Original Mortgage
$109,479
Interest Rate
3.75%
Mortgage Type
FHA
Create a Home Valuation Report for This Property
The Home Valuation Report is an in-depth analysis detailing your home's value as well as a comparison with similar homes in the area
Home Values in the Area
Average Home Value in this Area
Purchase History
| Date | Buyer | Sale Price | Title Company |
|---|---|---|---|
| Heard Shonair | $174,900 | -- | |
| Andrews John R | $148,000 | -- | |
| Welch William R | $111,500 | -- |
Source: Public Records
Mortgage History
| Date | Status | Borrower | Loan Amount |
|---|---|---|---|
| Open | Heard Shonair | $166,155 | |
| Previous Owner | Andrews John R | $140,600 | |
| Previous Owner | Welch William R | $109,479 |
Source: Public Records
Tax History Compared to Growth
Tax History
| Year | Tax Paid | Tax Assessment Tax Assessment Total Assessment is a certain percentage of the fair market value that is determined by local assessors to be the total taxable value of land and additions on the property. | Land | Improvement |
|---|---|---|---|---|
| 2024 | $1,884 | $109,944 | $13,140 | $96,804 |
| 2023 | $1,922 | $75,649 | $3,859 | $71,790 |
| 2022 | $2,184 | $75,649 | $3,859 | $71,790 |
| 2021 | $2,012 | $64,141 | $3,859 | $60,282 |
| 2020 | $1,667 | $52,583 | $3,859 | $48,724 |
| 2019 | $1,647 | $50,932 | $3,859 | $47,073 |
| 2018 | $1,339 | $41,029 | $3,859 | $37,170 |
| 2017 | $1,338 | $41,029 | $3,859 | $37,170 |
| 2016 | $1,338 | $41,029 | $3,859 | $37,170 |
| 2015 | $1,350 | $41,028 | $3,859 | $37,170 |
| 2014 | $455 | $41,029 | $3,859 | $37,170 |
| 2013 | -- | $39,803 | $3,859 | $35,944 |
Source: Public Records
Map
Nearby Homes
- 2885 Longwood Rd
- 2867 Evergreen Rd
- 2836 Evergreen Rd
- 850 Woodard Ln
- 2857 Cherokee St
- 1238 Red Keen Rd
- 1261 Lake St
- 1210 N Augusta Ave
- 2117 Tamara Rd
- Lot 155 N Augusta Avenue Cherokee Ave
- 2066 Cherokee St
- 1300 Stanton Ave
- 0 Anita South St
- 274 S Anita St
- 2180 Fulford Rd Unit n/a
- 2869 Ben St
- 2879 Ben St
- 2885 Ben St
- 221 Sierra Ln
- 1953 State St
- 1249 Gorman Rd
- 1269 Gorman Rd
- 1218 Crestridge Rd
- 1248 Crestridge Rd
- 1250 Gorman Rd
- 1289 Gorman Rd
- 1239 Crestridge Rd
- 1157 Gorman Rd
- 1309 Gorman Rd
- 1180 Gorman Rd
- 1288 Crestridge Rd
- 1136 Crestridge Rd
- 1159 Crestridge Rd
- 2679 Lamar Avenue Extension
- 1328 Crestridge Rd
- 1131 Gorman Rd
- 1269 Crestridge Rd
- 1209 Crestridge Rd
- 2678 Lamar Avenue Extension
- 1300 Gorman Rd