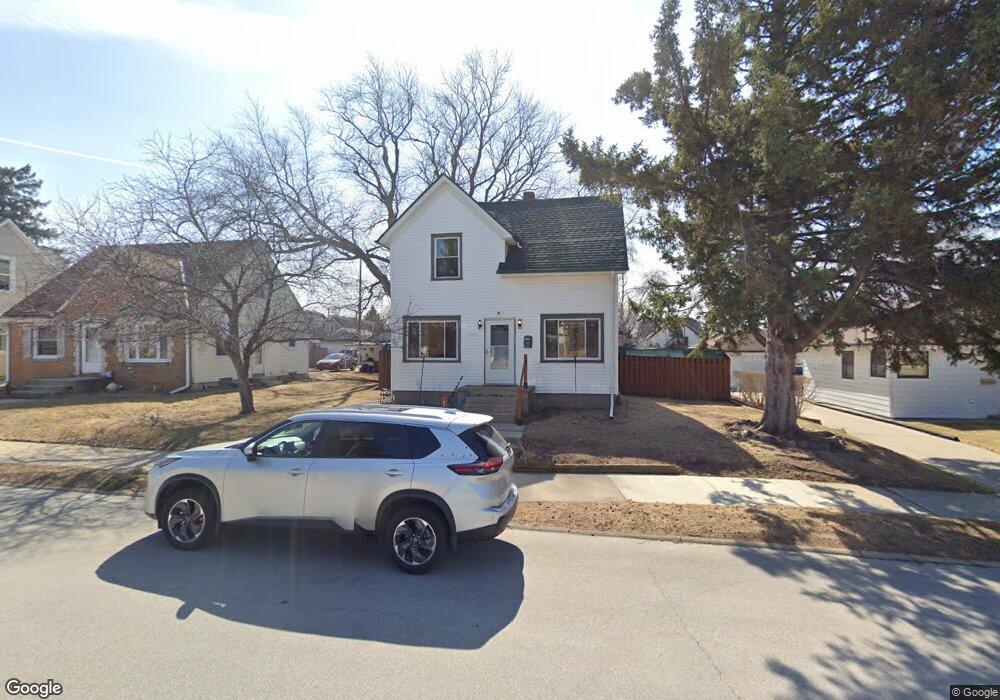
1219 Menomonee Ave South Milwaukee, WI 53172
Drexel Highlands NeighborhoodEstimated Value: $220,000 - $294,000
--
Bed
--
Bath
1,464
Sq Ft
$179/Sq Ft
Est. Value
About This Home
This home is located at 1219 Menomonee Ave, South Milwaukee, WI 53172 and is currently estimated at $262,368, approximately $179 per square foot. 1219 Menomonee Ave is a home located in Milwaukee County with nearby schools including Blakewood Elementary School, South Milwaukee Middle School, and South Milwaukee High School.
Ownership History
Date
Name
Owned For
Owner Type
Purchase Details
Closed on
Aug 18, 2021
Sold by
Rieder Mario V F
Bought by
Rieder Mario V F and Ring Jennifer A
Current Estimated Value
Purchase Details
Closed on
Jun 9, 2014
Sold by
Fannie Mae
Bought by
Rieder Mario V F
Home Financials for this Owner
Home Financials are based on the most recent Mortgage that was taken out on this home.
Original Mortgage
$66,225
Outstanding Balance
$50,372
Interest Rate
4.2%
Mortgage Type
New Conventional
Estimated Equity
$211,996
Purchase Details
Closed on
Mar 24, 2014
Sold by
Haensgen Mark L and Haensgen Michael J
Bought by
Federal National Mortgage Association and Fannie Mae
Purchase Details
Closed on
Aug 17, 2004
Sold by
Browy Eric C and Browy Sharon M
Bought by
Haensgen Michael J and Haensgen Mark L
Home Financials for this Owner
Home Financials are based on the most recent Mortgage that was taken out on this home.
Original Mortgage
$118,800
Interest Rate
5.95%
Mortgage Type
Purchase Money Mortgage
Create a Home Valuation Report for This Property
The Home Valuation Report is an in-depth analysis detailing your home's value as well as a comparison with similar homes in the area
Home Values in the Area
Average Home Value in this Area
Purchase History
| Date | Buyer | Sale Price | Title Company |
|---|---|---|---|
| Rieder Mario V F | -- | None Available | |
| Rieder Mario V F | -- | Merit Title | |
| Federal National Mortgage Association | $134,657 | None Available | |
| Haensgen Michael J | $132,000 | -- |
Source: Public Records
Mortgage History
| Date | Status | Borrower | Loan Amount |
|---|---|---|---|
| Open | Rieder Mario V F | $66,225 | |
| Previous Owner | Haensgen Michael J | $118,800 |
Source: Public Records
Tax History Compared to Growth
Tax History
| Year | Tax Paid | Tax Assessment Tax Assessment Total Assessment is a certain percentage of the fair market value that is determined by local assessors to be the total taxable value of land and additions on the property. | Land | Improvement |
|---|---|---|---|---|
| 2024 | $1,721 | $178,000 | $67,200 | $110,800 |
| 2023 | $3,348 | $178,000 | $67,200 | $110,800 |
| 2022 | $3,409 | $178,000 | $67,200 | $110,800 |
| 2021 | $3,108 | $118,000 | $50,000 | $68,000 |
| 2020 | $3,141 | $118,000 | $50,000 | $68,000 |
| 2019 | $3,070 | $118,000 | $50,000 | $68,000 |
| 2018 | $3,358 | $118,000 | $50,000 | $68,000 |
| 2017 | $2,983 | $118,000 | $50,000 | $68,000 |
| 2016 | $2,917 | $118,000 | $50,000 | $68,000 |
| 2015 | $2,932 | $118,000 | $50,000 | $68,000 |
| 2014 | $2,862 | $118,000 | $50,000 | $68,000 |
| 2013 | $3,567 | $118,000 | $50,000 | $68,000 |
Source: Public Records
Map
Nearby Homes
- 2703 S Chicago Ave
- 2713 S Chicago Ave
- 1329 Drexel Blvd
- 1320 Milwaukee Ave
- 1217 Blake Ave
- 1002 Milwaukee Ave
- 729 Montana Ave
- 1228 Lakeview Ave
- 1731 Mackinac Ave
- 913 Manitoba Ave
- 3601 15th Ave
- 1800 Mackinac Ave
- 615 Blake Ave
- 1722 Manitoba Ave
- 624 Clark Ave
- 2701 4th Ave
- 3651 E Barbara Ct Unit 10
- 2227 E Excalibur Ct Unit 2227
- 1216 N Chicago Ave
- 625 Edgewood Ave
- 1217 Menomonee Ave
- 1231 Menomonee Ave
- 1215 Menomonee Ave
- 1213 Menomonee Ave
- 1235 Menomonee Ave
- 1220 Marion Ave
- 1224 Marion Ave
- 1209 Menomonee Ave
- 1226 Marion Ave
- 1208 Marion Ave
- 1226 Menomonee Ave
- 1220 Menomonee Ave
- 1230 Menomonee Ave
- 1214 Menomonee Ave
- 1206 Marion Ave
- 1212 Menomonee Ave
- 2509 13th Ave
- 2602 13th Ave
- 1206 Menomonee Ave
- 2608 S Chicago Ave