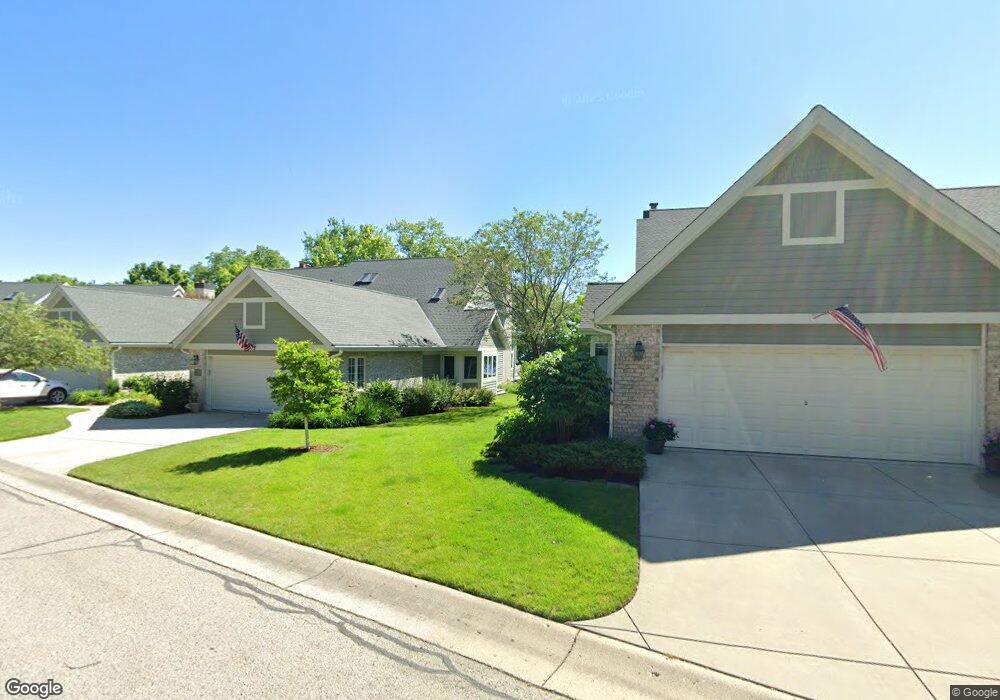
1219 Milwaukee St Delafield, WI 53018
Estimated Value: $1,905,737 - $2,010,000
3
Beds
4
Baths
--
Sq Ft
302,176
Sq Ft Lot
About This Home
This home is located at 1219 Milwaukee St, Delafield, WI 53018 and is currently estimated at $1,957,869. 1219 Milwaukee St is a home located in Waukesha County with nearby schools including Cushing Elementary School, Kettle Moraine Middle School, and Kettle Moraine High School.
Ownership History
Date
Name
Owned For
Owner Type
Purchase Details
Closed on
Oct 23, 2019
Sold by
Bliwas M D Crain H M and Bliwas Margaret A
Bought by
Reeser Frederick H and Reeser Rhonda P
Current Estimated Value
Home Financials for this Owner
Home Financials are based on the most recent Mortgage that was taken out on this home.
Original Mortgage
$1,000,000
Outstanding Balance
$668,369
Interest Rate
3.6%
Mortgage Type
New Conventional
Estimated Equity
$1,289,500
Purchase Details
Closed on
Jul 1, 2014
Sold by
Harrington Thomas R and Harrington Sharon L
Bought by
Orlando Frederick A and Orlando Caryl A
Purchase Details
Closed on
Oct 18, 2000
Sold by
Harrington Thomas R and Harrington Sharon L
Bought by
Thomas R & Sharon L Harrington Revocable
Purchase Details
Closed on
Apr 18, 1996
Sold by
G & F Development Corp
Bought by
Harrington Sharon L and Harrington Thomas R
Create a Home Valuation Report for This Property
The Home Valuation Report is an in-depth analysis detailing your home's value as well as a comparison with similar homes in the area
Home Values in the Area
Average Home Value in this Area
Purchase History
| Date | Buyer | Sale Price | Title Company |
|---|---|---|---|
| Reeser Frederick H | $1,400,000 | None Available | |
| Orlando Frederick A | $1,015,000 | None Available | |
| Thomas R & Sharon L Harrington Revocable | -- | -- | |
| Harrington Sharon L | $185,000 | -- |
Source: Public Records
Mortgage History
| Date | Status | Borrower | Loan Amount |
|---|---|---|---|
| Open | Reeser Frederick H | $1,000,000 | |
| Closed | Harrington Sharon L | $0 |
Source: Public Records
Tax History
| Year | Tax Paid | Tax Assessment Tax Assessment Total Assessment is a certain percentage of the fair market value that is determined by local assessors to be the total taxable value of land and additions on the property. | Land | Improvement |
|---|---|---|---|---|
| 2024 | $15,991 | $1,191,300 | $424,800 | $766,500 |
| 2023 | $15,588 | $1,191,300 | $424,800 | $766,500 |
| 2022 | $14,989 | $1,191,300 | $424,800 | $766,500 |
| 2021 | $14,996 | $928,300 | $354,000 | $574,300 |
| 2020 | $15,062 | $928,300 | $354,000 | $574,300 |
| 2019 | $14,398 | $928,300 | $354,000 | $574,300 |
| 2018 | $13,803 | $912,400 | $354,000 | $558,400 |
| 2017 | $13,668 | $912,400 | $354,000 | $558,400 |
| 2016 | $13,895 | $912,400 | $354,000 | $558,400 |
| 2015 | $14,472 | $912,400 | $354,000 | $558,400 |
| 2014 | $14,124 | $848,700 | $354,000 | $494,700 |
| 2013 | $14,124 | $854,000 | $354,000 | $500,000 |
Source: Public Records
Map
Nearby Homes
- 1213 Main St
- 637 1st St
- 805 Wells St Unit 4
- 805 Wells St Unit 2
- 805 Wells St Unit 3
- 805 Wells St Unit 1
- 1001 Park Way
- 1026 Park Way
- 545 Wisconsin Ave
- 311 S Lapham Peak Rd Unit 13
- 2736 Nagawicka Ave
- 3024 Nagawicka Ave
- 323 Riverview Dr Unit 4
- 1815 Bark River Dr
- W304N2426 Maple Ave
- W305N2808 Foxwood Ct
- N24W30375 Crystal Springs Dr
- N41W33425 Nashotah Rd
- N43W32801 Rasmus Rd Unit 9D
- N43W32953 Rasmus Rd Unit 3-H
- 1229 Milwaukee St Unit 15
- 1229 Milwaukee St Unit 16
- 1223 Milwaukee St Unit 10
- 1223 Milwaukee St Unit A
- 1229 Milwaukee St Unit B
- 1227 Milwaukee St Unit 13
- 1215 Milwaukee St
- 1225B Milwaukee St Unit 12
- 1223A Milwaukee St Unit 9
- 1221A Milwaukee St Unit 7
- 1227B Milwaukee St Unit 14
- 1221B Milwaukee St Unit 8
- 1225A Milwaukee St
- 1217B Milwaukee St
- 1217A Milwaukee St
- 1215B Milwaukee St
- 1303 Milwaukee St
- 1309 Milwaukee St
- 1207 Milwaukee St
- 1133 Milwaukee St
Your Personal Tour Guide
Ask me questions while you tour the home.