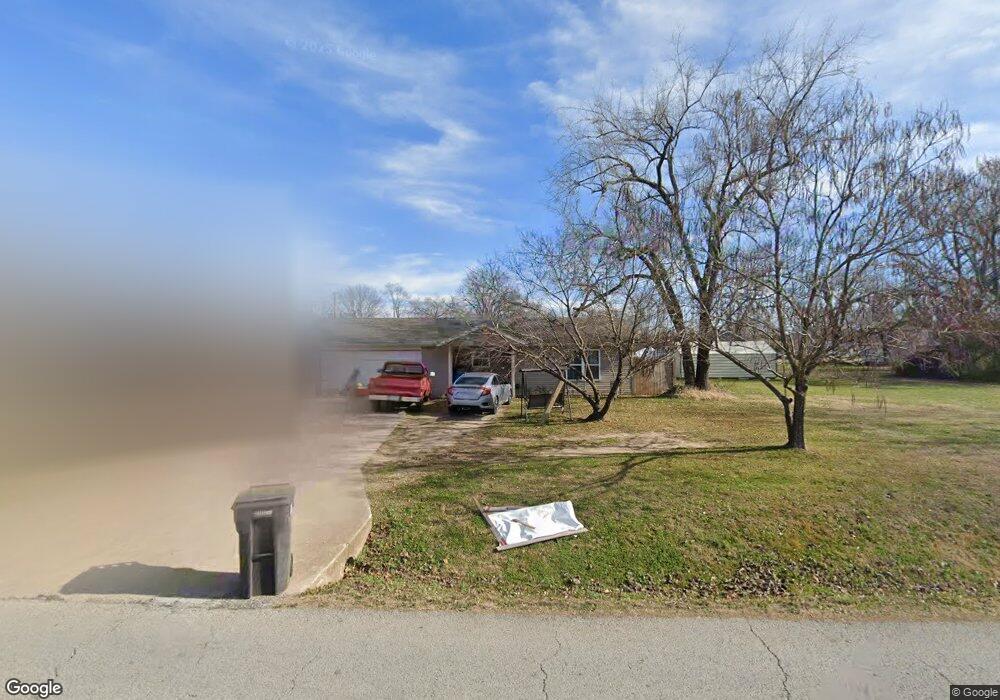
1219 N Arkansas St Rogers, AR 72756
Estimated Value: $222,000 - $256,000
3
Beds
2
Baths
1,161
Sq Ft
$203/Sq Ft
Est. Value
About This Home
This home is located at 1219 N Arkansas St, Rogers, AR 72756 and is currently estimated at $235,171, approximately $202 per square foot. 1219 N Arkansas St is a home located in Benton County with nearby schools including Frank Tillery Elementary School, Lingle Middle School, and Rogers Heritage High School.
Ownership History
Date
Name
Owned For
Owner Type
Purchase Details
Closed on
Nov 18, 2005
Sold by
Phillips William Floyd and Phillips Kelly
Bought by
Pina Abel
Current Estimated Value
Home Financials for this Owner
Home Financials are based on the most recent Mortgage that was taken out on this home.
Original Mortgage
$106,000
Outstanding Balance
$58,150
Interest Rate
6.06%
Mortgage Type
New Conventional
Estimated Equity
$177,021
Purchase Details
Closed on
Nov 16, 2005
Sold by
Phillips William Floyd and Phillips Kelly
Bought by
Pina Abel
Home Financials for this Owner
Home Financials are based on the most recent Mortgage that was taken out on this home.
Original Mortgage
$106,000
Outstanding Balance
$58,150
Interest Rate
6.06%
Mortgage Type
New Conventional
Estimated Equity
$177,021
Purchase Details
Closed on
May 26, 1994
Bought by
Phillips
Purchase Details
Closed on
Sep 2, 1988
Bought by
Phillips
Purchase Details
Closed on
Oct 13, 1976
Bought by
Phillips
Create a Home Valuation Report for This Property
The Home Valuation Report is an in-depth analysis detailing your home's value as well as a comparison with similar homes in the area
Home Values in the Area
Average Home Value in this Area
Purchase History
| Date | Buyer | Sale Price | Title Company |
|---|---|---|---|
| Pina Abel | $106,000 | Waco Title Company | |
| Pina Abel | $106,000 | Stewart Title Of Arkansas In | |
| Phillips | -- | -- | |
| Phillips | -- | -- | |
| Phillips | -- | -- |
Source: Public Records
Mortgage History
| Date | Status | Borrower | Loan Amount |
|---|---|---|---|
| Open | Pina Abel | $106,000 |
Source: Public Records
Tax History Compared to Growth
Tax History
| Year | Tax Paid | Tax Assessment Tax Assessment Total Assessment is a certain percentage of the fair market value that is determined by local assessors to be the total taxable value of land and additions on the property. | Land | Improvement |
|---|---|---|---|---|
| 2025 | $1,232 | $41,137 | $8,000 | $33,137 |
| 2024 | $1,102 | $41,137 | $8,000 | $33,137 |
| 2023 | $1,002 | $26,840 | $8,000 | $18,840 |
| 2022 | $961 | $26,840 | $8,000 | $18,840 |
| 2021 | $879 | $26,840 | $8,000 | $18,840 |
| 2020 | $799 | $14,560 | $1,400 | $13,160 |
| 2019 | $799 | $14,560 | $1,400 | $13,160 |
| 2018 | $799 | $14,560 | $1,400 | $13,160 |
| 2017 | $756 | $14,560 | $1,400 | $13,160 |
| 2016 | $756 | $14,560 | $1,400 | $13,160 |
| 2015 | $1,053 | $19,910 | $2,600 | $17,310 |
| 2014 | $1,053 | $19,910 | $2,600 | $17,310 |
Source: Public Records
Map
Nearby Homes
- 1409 N Arkansas St
- 1403 N D St
- 715 N C St
- 1707 N C St
- 615 Prairie Creek Dr
- 742 N 5th St
- 753 N 6th St
- 606 Will Rogers Dr
- 509 N 3rd St
- 832 E Hilltop Dr
- 709 N 6th St
- 707 N 6th St
- 418,420,422,424 N F St
- 804 N 7th St
- 906 N 8th St
- 510 W Persimmon St
- 1420 Woodland Dr
- 908 N 9th St
- 814 Summit Loop
- 201 E Walnut St