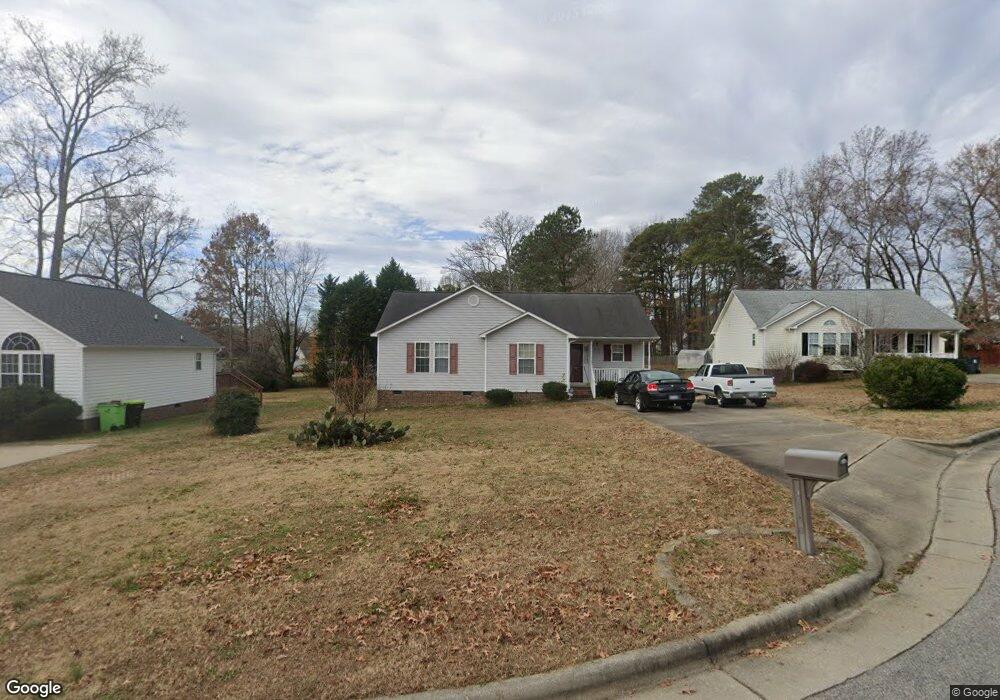
1219 Piney Glen Ln Zebulon, NC 27597
Estimated Value: $278,000 - $296,000
3
Beds
2
Baths
1,289
Sq Ft
$222/Sq Ft
Est. Value
About This Home
This home is located at 1219 Piney Glen Ln, Zebulon, NC 27597 and is currently estimated at $286,324, approximately $222 per square foot. 1219 Piney Glen Ln is a home located in Wake County with nearby schools including Wakelon Elementary School, Zebulon Magnet Middle School, and East Wake High School.
Ownership History
Date
Name
Owned For
Owner Type
Purchase Details
Closed on
Aug 5, 2015
Sold by
Wade Katie Eugenia
Bought by
Tidewater Investors X Llc
Current Estimated Value
Purchase Details
Closed on
Feb 27, 2006
Sold by
Byrd Schwartz Mary F
Bought by
Wade Katie Eugenia
Home Financials for this Owner
Home Financials are based on the most recent Mortgage that was taken out on this home.
Original Mortgage
$104,405
Interest Rate
6.08%
Mortgage Type
Fannie Mae Freddie Mac
Purchase Details
Closed on
Oct 24, 2003
Sold by
Byrd Geneva
Bought by
Byrd Schwartz Mary F
Purchase Details
Closed on
Jul 1, 1999
Sold by
Southland Builders Inc
Bought by
Bryd Schwartz Mary and Dodd Evelyn
Home Financials for this Owner
Home Financials are based on the most recent Mortgage that was taken out on this home.
Original Mortgage
$93,950
Interest Rate
7.27%
Create a Home Valuation Report for This Property
The Home Valuation Report is an in-depth analysis detailing your home's value as well as a comparison with similar homes in the area
Home Values in the Area
Average Home Value in this Area
Purchase History
| Date | Buyer | Sale Price | Title Company |
|---|---|---|---|
| Tidewater Investors X Llc | $85,000 | Attorney | |
| Wade Katie Eugenia | $110,000 | None Available | |
| Byrd Schwartz Mary F | -- | -- | |
| Bryd Schwartz Mary | $97,000 | -- |
Source: Public Records
Mortgage History
| Date | Status | Borrower | Loan Amount |
|---|---|---|---|
| Previous Owner | Wade Katie Eugenia | $104,405 | |
| Previous Owner | Bryd Schwartz Mary | $93,950 |
Source: Public Records
Tax History Compared to Growth
Tax History
| Year | Tax Paid | Tax Assessment Tax Assessment Total Assessment is a certain percentage of the fair market value that is determined by local assessors to be the total taxable value of land and additions on the property. | Land | Improvement |
|---|---|---|---|---|
| 2025 | $2,995 | $271,939 | $75,000 | $196,939 |
| 2024 | $2,986 | $271,939 | $75,000 | $196,939 |
| 2023 | $1,886 | $151,441 | $28,000 | $123,441 |
| 2022 | $1,829 | $151,441 | $28,000 | $123,441 |
| 2021 | $1,762 | $151,441 | $28,000 | $123,441 |
| 2020 | $1,762 | $151,441 | $28,000 | $123,441 |
| 2019 | $1,530 | $115,065 | $20,000 | $95,065 |
| 2018 | $1,454 | $115,065 | $20,000 | $95,065 |
| 2017 | $1,389 | $115,065 | $20,000 | $95,065 |
| 2016 | $0 | $115,065 | $20,000 | $95,065 |
| 2015 | -- | $118,921 | $24,000 | $94,921 |
| 2014 | $1,332 | $118,921 | $24,000 | $94,921 |
Source: Public Records
Map
Nearby Homes
- Bloomfield Plan at Cadence Meadows - Townes
- Thorton Plan at Cadence Meadows - Townes
- Sherwood Plan at Cadence Meadows
- Lakewood Plan at Cadence Meadows - Townes
- Taylorsville Plan at Cadence Meadows
- Johnson Plan at Cadence Meadows
- Chatham Plan at Cadence Meadows
- 1200 Whitespire Way
- 1204 Whitespire Way
- 1208 Whitespire Way
- 1212 Whitespire Way
- 1201 Whitespire Way
- 1216 Whitespire Way
- 1205 Whitespire Way
- 1209 Whitespire Way
- 1213 Whitespire Way
- 1224 Whitespire Way
- 1217 Whitespire Way
- 204 Southland Dr
- 1228 Whitespire Way
- 1215 Piney Glen Ln
- 1223 Piney Glen Ln
- 1204 Golden Slipper Ct
- 1227 Piney Glen Ln
- 1211 Piney Glen Ln
- 1208 Golden Slipper Ct
- 1200 Golden Slipper Ct
- 1222 Piney Glen Ln
- 1218 Piney Glen Ln
- 1226 Piney Glen Ln
- 1214 Piney Glen Ln
- 1210 Golden Slipper Ct
- 1313 Sasswood Ln
- 1311 Sasswood Ln
- 1315 Sasswood Ln
- 1307 Sasswood Ln
- 1309 Sasswood Ln
- 1212 Piney Glen Ln
- 1421 Smokey Mountain Dr
- 1317 Sasswood Ln