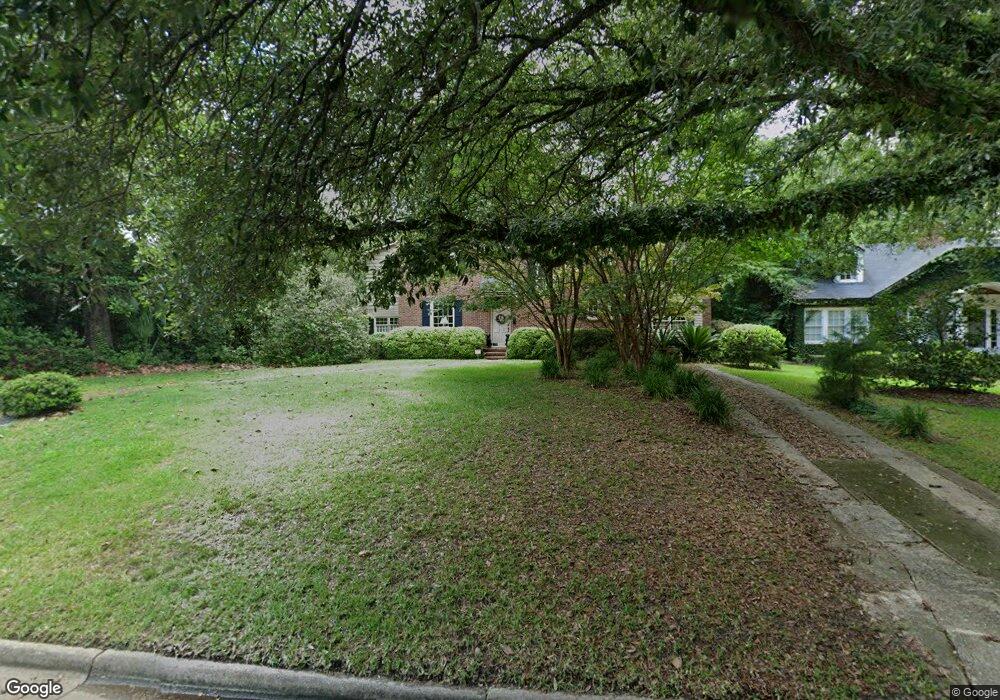
1219 Rawson Dr Albany, GA 31701
Rawson Park NeighborhoodEstimated Value: $173,060 - $263,000
3
Beds
3
Baths
2,538
Sq Ft
$86/Sq Ft
Est. Value
About This Home
This home is located at 1219 Rawson Dr, Albany, GA 31701 and is currently estimated at $218,515, approximately $86 per square foot. 1219 Rawson Dr is a home located in Dougherty County with nearby schools including Northside Elementary School, Albany Middle School, and Albany High School.
Ownership History
Date
Name
Owned For
Owner Type
Purchase Details
Closed on
Jun 26, 2024
Sold by
Turner Danna B
Bought by
Turner Danna B and Herben Turner E
Current Estimated Value
Purchase Details
Closed on
Jun 19, 1998
Sold by
Turner E Herben
Bought by
Turner Turner E and Turner Danna B
Purchase Details
Closed on
Jun 4, 1976
Sold by
Greenholtz H T
Bought by
Turner E Herben
Create a Home Valuation Report for This Property
The Home Valuation Report is an in-depth analysis detailing your home's value as well as a comparison with similar homes in the area
Home Values in the Area
Average Home Value in this Area
Purchase History
| Date | Buyer | Sale Price | Title Company |
|---|---|---|---|
| Turner Danna B | -- | -- | |
| Turner Turner E | -- | -- | |
| Turner E Herben | -- | -- |
Source: Public Records
Tax History Compared to Growth
Tax History
| Year | Tax Paid | Tax Assessment Tax Assessment Total Assessment is a certain percentage of the fair market value that is determined by local assessors to be the total taxable value of land and additions on the property. | Land | Improvement |
|---|---|---|---|---|
| 2024 | $1,973 | $43,360 | $8,720 | $34,640 |
| 2023 | $1,088 | $43,360 | $8,720 | $34,640 |
| 2022 | $1,934 | $43,360 | $8,720 | $34,640 |
| 2021 | $1,793 | $43,360 | $8,720 | $34,640 |
| 2020 | $1,797 | $43,360 | $8,720 | $34,640 |
| 2019 | $1,804 | $43,360 | $8,720 | $34,640 |
| 2018 | $1,812 | $43,360 | $8,720 | $34,640 |
| 2017 | $1,688 | $43,360 | $8,720 | $34,640 |
| 2016 | $1,689 | $43,360 | $8,720 | $34,640 |
| 2015 | $1,693 | $43,360 | $8,720 | $34,640 |
| 2014 | $1,740 | $45,040 | $10,400 | $34,640 |
Source: Public Records
Map
Nearby Homes