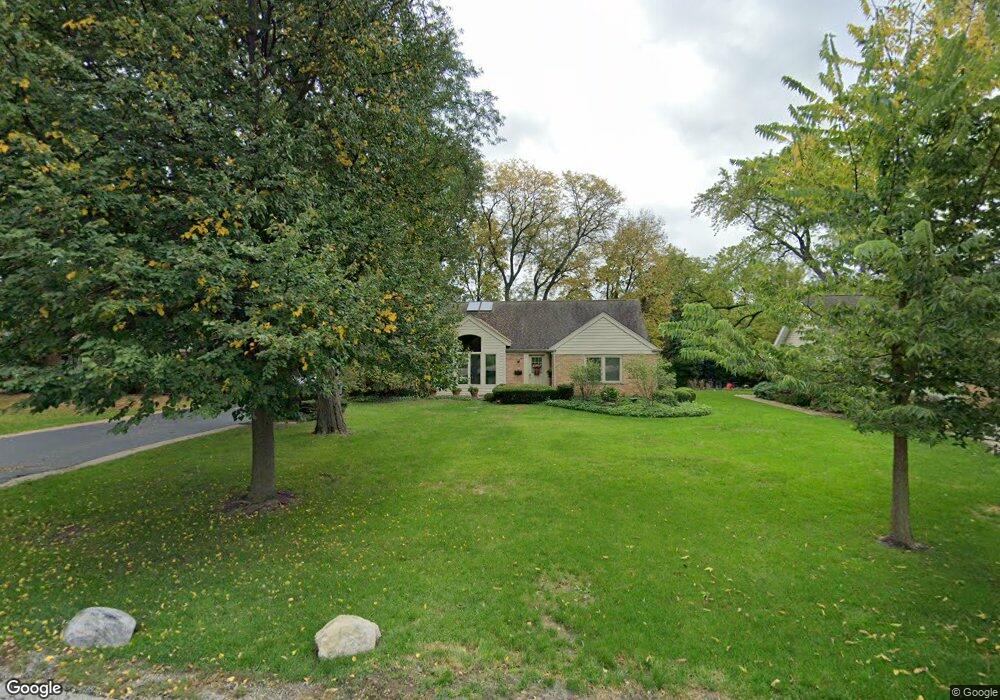
1219 W Watling St Arlington Heights, IL 60004
Estimated Value: $554,000 - $818,000
3
Beds
2
Baths
1,827
Sq Ft
$361/Sq Ft
Est. Value
About This Home
This home is located at 1219 W Watling St, Arlington Heights, IL 60004 and is currently estimated at $659,488, approximately $360 per square foot. 1219 W Watling St is a home located in Cook County with nearby schools including Patton Elementary School, Thomas Middle School, and John Hersey High School.
Ownership History
Date
Name
Owned For
Owner Type
Purchase Details
Closed on
Sep 21, 1996
Sold by
Seevers Joan K and Holland Joan K
Bought by
Seevers Joan K
Current Estimated Value
Create a Home Valuation Report for This Property
The Home Valuation Report is an in-depth analysis detailing your home's value as well as a comparison with similar homes in the area
Home Values in the Area
Average Home Value in this Area
Purchase History
| Date | Buyer | Sale Price | Title Company |
|---|---|---|---|
| Seevers Joan K | -- | -- |
Source: Public Records
Tax History Compared to Growth
Tax History
| Year | Tax Paid | Tax Assessment Tax Assessment Total Assessment is a certain percentage of the fair market value that is determined by local assessors to be the total taxable value of land and additions on the property. | Land | Improvement |
|---|---|---|---|---|
| 2024 | $11,113 | $46,563 | $22,500 | $24,063 |
| 2023 | $10,653 | $46,563 | $22,500 | $24,063 |
| 2022 | $10,653 | $46,563 | $22,500 | $24,063 |
| 2021 | $11,023 | $42,614 | $12,375 | $30,239 |
| 2020 | $10,858 | $42,614 | $12,375 | $30,239 |
| 2019 | $10,853 | $47,508 | $12,375 | $35,133 |
| 2018 | $10,992 | $43,852 | $10,875 | $32,977 |
| 2017 | $10,214 | $43,852 | $10,875 | $32,977 |
| 2016 | $10,643 | $43,852 | $10,875 | $32,977 |
| 2015 | $9,257 | $35,848 | $9,375 | $26,473 |
| 2014 | $9,359 | $37,054 | $9,375 | $27,679 |
| 2013 | $9,095 | $37,054 | $9,375 | $27,679 |
Source: Public Records
Map
Nearby Homes
- 1326 N Race Ave
- 628 S Wilke Rd
- 543 S Warren Ave
- 1750 W Thomas St
- 1237 N Ridge Ave
- 1416 W Lynnwood Ave
- 1518 N Patton Ave
- 1136 N Walnut Ave
- 1605 N Chicago Ave
- 1418 W Maude Ave
- 1142 N Mitchell Ave
- 1317 N Mitchell Ave
- 1542 E Baronet Ln Unit 120300
- 827 N Walnut Ave
- 910 N Chestnut Ave
- 617 N Wilke Rd
- 924 N Highland Ave
- 1825 N Kaspar Ave
- 1001 N Dunton Ave
- 1417 E Joyce Ave
- 1303 W Watling St
- 1215 W Watling St
- 1218 W Clarendon Rd
- 1212 W Clarendon Rd
- 1315 W Watling St
- 1226 W Clarendon Rd
- 1220 N Harvard Ave
- 1206 N Harvard Ave
- 1308 W Watling St
- 1300 W Clarendon Rd
- 1314 W Watling St
- 1319 W Watling St
- 1206 W Watling St
- 1144 N Harvard Ave
- 1249 N Yale Ave
- 1221 W Clarendon Rd
- 1314 W Clarendon Rd
- 1110 W Clarendon Rd
- 1221 N Harvard Ave
- 1228 N Yale Ave