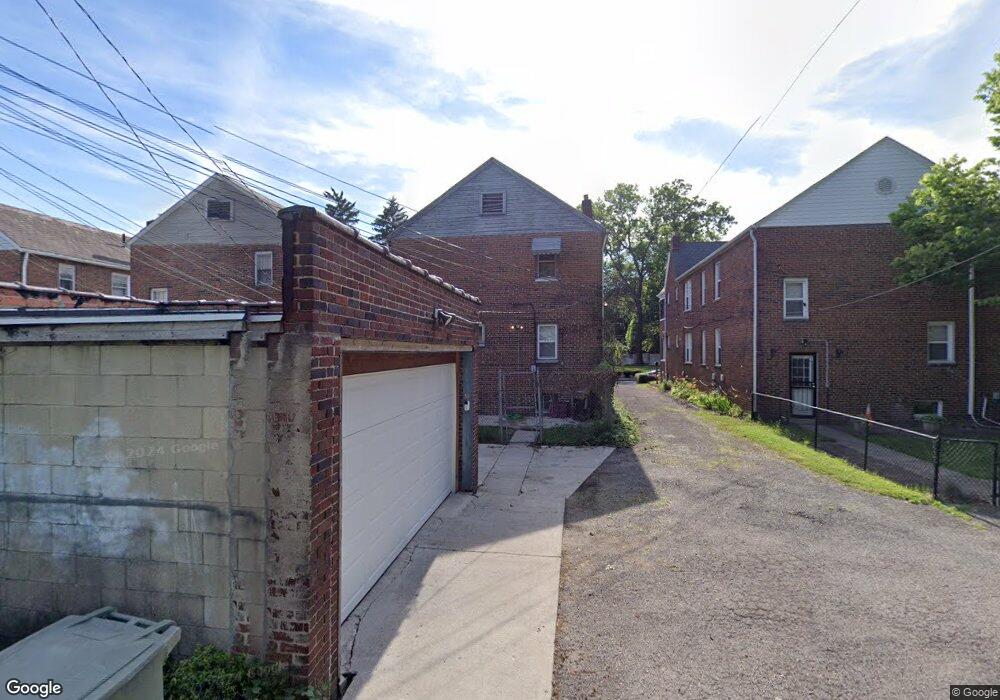
122-124 Brunson Ave Columbus, OH 43203
Woodland Park NeighborhoodEstimated Value: $326,000 - $416,000
6
Beds
2
Baths
2,700
Sq Ft
$132/Sq Ft
Est. Value
About This Home
This home is located at 122-124 Brunson Ave, Columbus, OH 43203 and is currently estimated at $357,443, approximately $132 per square foot. 122-124 Brunson Ave is a home located in Franklin County with nearby schools including Eastgate Elementary School, Champion Middle School, and East High School.
Ownership History
Date
Name
Owned For
Owner Type
Purchase Details
Closed on
Sep 27, 2023
Sold by
Steigerwalt Daniel and Steigerwalt Alyssa
Bought by
Russo Alyssa
Current Estimated Value
Home Financials for this Owner
Home Financials are based on the most recent Mortgage that was taken out on this home.
Original Mortgage
$299,250
Outstanding Balance
$293,487
Interest Rate
7.23%
Mortgage Type
New Conventional
Estimated Equity
$63,956
Purchase Details
Closed on
Sep 18, 2023
Sold by
Steigerwalt Daniel and Steigerwalt Alyssa
Bought by
Russo Alyssa
Home Financials for this Owner
Home Financials are based on the most recent Mortgage that was taken out on this home.
Original Mortgage
$299,250
Outstanding Balance
$293,487
Interest Rate
7.23%
Mortgage Type
New Conventional
Estimated Equity
$63,956
Purchase Details
Closed on
Jan 22, 2019
Sold by
Mack Abigail and The Abigail Cooper White Mack
Bought by
Steigerwalt Daniel and Steigerwalt Alyssa
Home Financials for this Owner
Home Financials are based on the most recent Mortgage that was taken out on this home.
Original Mortgage
$197,250
Interest Rate
4.6%
Mortgage Type
New Conventional
Purchase Details
Closed on
Jan 5, 2017
Sold by
Thompson Calotta
Bought by
Mack Abigail and The Abigail Cooper Whtie Madk
Purchase Details
Closed on
May 1, 1986
Create a Home Valuation Report for This Property
The Home Valuation Report is an in-depth analysis detailing your home's value as well as a comparison with similar homes in the area
Home Values in the Area
Average Home Value in this Area
Purchase History
| Date | Buyer | Sale Price | Title Company |
|---|---|---|---|
| Russo Alyssa | $315,000 | Stewart Title | |
| Russo Alyssa | $315,000 | Stewart Title | |
| Steigerwalt Daniel | $263,000 | None Available | |
| Mack Abigail | $145,000 | None Available | |
| -- | $49,800 | -- |
Source: Public Records
Mortgage History
| Date | Status | Borrower | Loan Amount |
|---|---|---|---|
| Open | Russo Alyssa | $299,250 | |
| Closed | Russo Alyssa | $299,250 | |
| Previous Owner | Steigerwalt Daniel | $197,250 |
Source: Public Records
Tax History Compared to Growth
Tax History
| Year | Tax Paid | Tax Assessment Tax Assessment Total Assessment is a certain percentage of the fair market value that is determined by local assessors to be the total taxable value of land and additions on the property. | Land | Improvement |
|---|---|---|---|---|
| 2024 | $4,342 | $95,730 | $20,060 | $75,670 |
| 2023 | $4,374 | $96,640 | $20,060 | $76,580 |
| 2022 | $4,892 | $92,050 | $1,120 | $90,930 |
| 2021 | $4,901 | $92,050 | $1,120 | $90,930 |
| 2020 | $2,706 | $50,750 | $1,120 | $49,630 |
| 2019 | $3,156 | $50,750 | $1,120 | $49,630 |
| 2018 | $2,886 | $50,750 | $1,120 | $49,630 |
| 2017 | $1,897 | $30,520 | $1,120 | $29,400 |
| 2016 | $1,498 | $22,050 | $3,430 | $18,620 |
| 2015 | $1,364 | $22,050 | $3,430 | $18,620 |
| 2014 | $1,367 | $22,050 | $3,430 | $18,620 |
| 2013 | $643 | $21,000 | $3,255 | $17,745 |
Source: Public Records
Map
Nearby Homes
- 54 Woodland Ave
- 34 Woodland Ave
- 1880 Greenway Ave S
- 1622 Clifton Ave
- 1872 Greenway Ave S
- 1593 Clifton Ave
- 220 Parkwood Ave Unit 222
- 1620 E Broad St Unit 1108
- 334 Woodland Ave
- 1562 Richmond Ave
- 1575 Granville St
- 1517 Hawthorne Ave
- 1634-1636 Greenway Ave
- 291 Sherborne Dr
- 280 Taylor Ave
- 330 Taylor Ave
- 495 Eldridge Ave
- 1598 Harvard Ave
- 1458 Harvard Ave
- 0 Harvard Ave
- 122 Brunson Ave Unit 124
- 122 Brunson Ave Unit 4
- 118 Brunson Ave Unit 120
- 126 Brunson Ave Unit 128
- 126 Brunson Ave Unit 2
- 112 Brunson Ave Unit 114
- 132 Brunson Ave Unit 8
- 132 Brunson Ave Unit 132-136
- 132 Brunson Ave
- 132-136 Brunson Ave
- 136 Brunson Ave
- 108 Brunson Ave Unit 110
- 144 1/2 Brunson Ave
- 140 Brunson Ave
- 140 Brunson Ave
- 140 Brunson Ave Unit 140-144
- 102 Brunson Ave Unit 104
- 117 Brunson Ave Unit 119
- 144 Brunson Ave
- 140-144 Brunson Ave