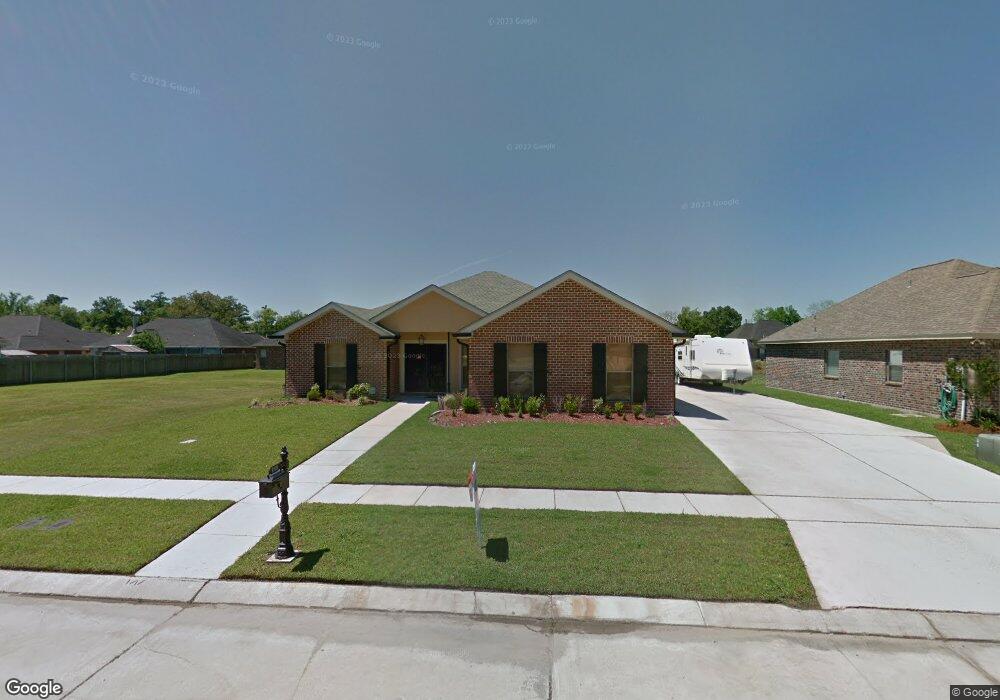
122 Allison Dr Luling, LA 70070
Estimated Value: $357,446 - $375,000
3
Beds
2
Baths
2,031
Sq Ft
$179/Sq Ft
Est. Value
About This Home
This home is located at 122 Allison Dr, Luling, LA 70070 and is currently estimated at $364,112, approximately $179 per square foot. 122 Allison Dr is a home located in St. Charles Parish with nearby schools including Mimosa Park Elementary School, Lakewood Elementary School, and J.B. Martin Middle School.
Ownership History
Date
Name
Owned For
Owner Type
Purchase Details
Closed on
Jun 2, 2011
Sold by
Giovengo Raymond J and Burlet Kelli
Bought by
Matthews Solveig Johansen and Kinler Bellew Janina
Current Estimated Value
Purchase Details
Closed on
Dec 4, 2006
Sold by
Ledet Carl V and Ledet Vicky Jones
Bought by
Giovengo Ii Raymod J and Giovengo Kelli Burlet
Create a Home Valuation Report for This Property
The Home Valuation Report is an in-depth analysis detailing your home's value as well as a comparison with similar homes in the area
Home Values in the Area
Average Home Value in this Area
Purchase History
| Date | Buyer | Sale Price | Title Company |
|---|---|---|---|
| Matthews Solveig Johansen | $250,000 | Delta Title Of Metairie | |
| Giovengo Ii Raymod J | $60,000 | None Available |
Source: Public Records
Tax History
| Year | Tax Paid | Tax Assessment Tax Assessment Total Assessment is a certain percentage of the fair market value that is determined by local assessors to be the total taxable value of land and additions on the property. | Land | Improvement |
|---|---|---|---|---|
| 2025 | $2,513 | $32,360 | $6,660 | $25,700 |
| 2024 | $2,513 | $32,360 | $6,660 | $25,700 |
| 2023 | $2,552 | $26,180 | $7,110 | $19,070 |
| 2022 | $3,061 | $26,180 | $7,110 | $19,070 |
| 2021 | $2,374 | $20,129 | $6,399 | $13,730 |
| 2020 | $3,093 | $26,180 | $7,110 | $19,070 |
| 2019 | $2,942 | $24,809 | $5,300 | $19,509 |
| 2018 | $2,919 | $24,809 | $5,300 | $19,509 |
| 2017 | $2,916 | $24,809 | $5,300 | $19,509 |
| 2016 | $2,928 | $24,809 | $5,300 | $19,509 |
| 2015 | $1,972 | $24,274 | $5,861 | $18,413 |
| 2014 | $1,900 | $24,274 | $5,861 | $18,413 |
| 2013 | $1,907 | $24,274 | $5,861 | $18,413 |
Source: Public Records
Map
Nearby Homes
Your Personal Tour Guide
Ask me questions while you tour the home.