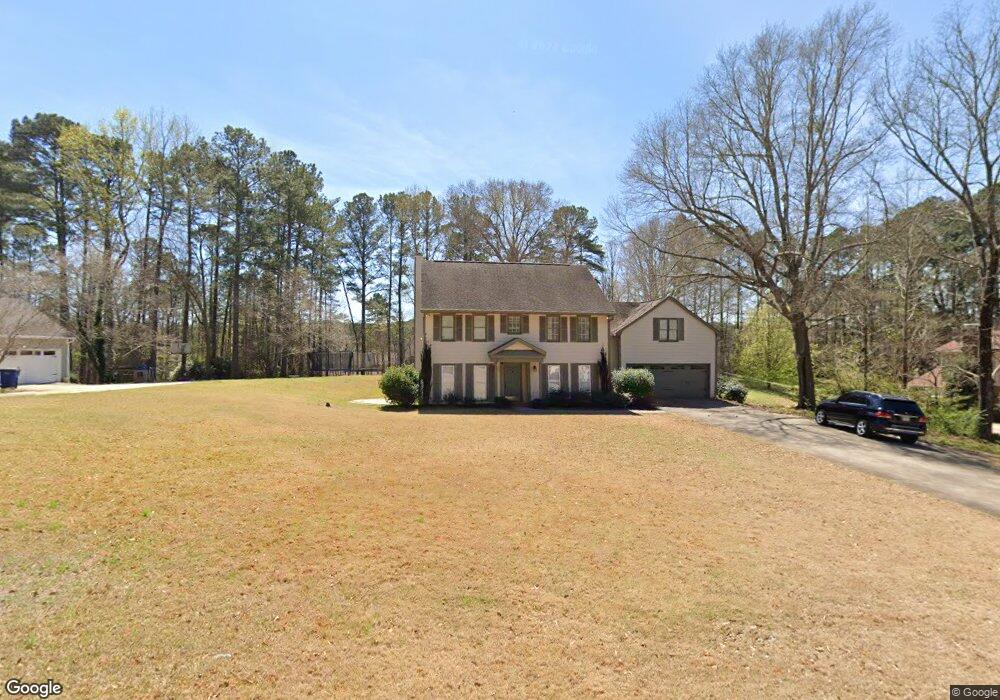
122 Ashling Dr Lagrange, GA 30240
Estimated Value: $353,000 - $376,000
4
Beds
5
Baths
2,377
Sq Ft
$153/Sq Ft
Est. Value
About This Home
This home is located at 122 Ashling Dr, Lagrange, GA 30240 and is currently estimated at $364,622, approximately $153 per square foot. 122 Ashling Dr is a home located in Troup County with nearby schools including Franklin Forest Elementary School, Hollis Hand Elementary School, and Ethel W. Kight Elementary School.
Ownership History
Date
Name
Owned For
Owner Type
Purchase Details
Closed on
Apr 16, 2012
Sold by
Federal Home Loan Mortgage Corporation
Bought by
Hembree James Brady and Hembree Jill W
Current Estimated Value
Home Financials for this Owner
Home Financials are based on the most recent Mortgage that was taken out on this home.
Original Mortgage
$147,941
Interest Rate
3.75%
Mortgage Type
FHA
Purchase Details
Closed on
Aug 2, 2011
Purchase Details
Closed on
May 26, 2006
Sold by
Us Sec Of Housing An
Bought by
Woodie Jason E and Woodie Ashley O
Purchase Details
Closed on
Dec 6, 2005
Sold by
Washington Mutual Bank
Bought by
Ry Of Housing & Urban Develo
Purchase Details
Closed on
Feb 4, 2003
Sold by
Belinda Thomas and Belinda Borders
Bought by
Richard Templeton
Purchase Details
Closed on
Nov 1, 1981
Sold by
Dan Ric and West Ga Est
Bought by
Belinda Thomas and Belinda Borders
Purchase Details
Closed on
Jun 29, 1981
Bought by
Dan Ric and West Ga Est
Create a Home Valuation Report for This Property
The Home Valuation Report is an in-depth analysis detailing your home's value as well as a comparison with similar homes in the area
Purchase History
| Date | Buyer | Sale Price | Title Company |
|---|---|---|---|
| Hembree James Brady | -- | -- | |
| Hembree Jason Brady | $151,790 | -- | |
| -- | $148,000 | -- | |
| -- | $140,000 | -- | |
| Woodie Jason E | $172,632 | -- | |
| Ry Of Housing & Urban Develo | $167,171 | -- | |
| Washington Mutual Bank | $167,171 | -- | |
| Richard Templeton | $145,000 | -- | |
| Belinda Thomas | $15,000 | -- | |
| Dan Ric | -- | -- |
Source: Public Records
Mortgage History
| Date | Status | Borrower | Loan Amount |
|---|---|---|---|
| Previous Owner | Hembree Jason Brady | $147,941 |
Source: Public Records
Tax History
| Year | Tax Paid | Tax Assessment Tax Assessment Total Assessment is a certain percentage of the fair market value that is determined by local assessors to be the total taxable value of land and additions on the property. | Land | Improvement |
|---|---|---|---|---|
| 2025 | $3,502 | $128,400 | $18,000 | $110,400 |
| 2024 | $3,045 | $111,640 | $18,000 | $93,640 |
| 2023 | $3,052 | $111,920 | $14,000 | $97,920 |
| 2022 | $2,936 | $105,200 | $14,000 | $91,200 |
| 2021 | $2,412 | $79,960 | $14,000 | $65,960 |
| 2020 | $2,412 | $79,960 | $14,000 | $65,960 |
| 2019 | $2,225 | $73,760 | $12,000 | $61,760 |
| 2018 | $2,120 | $70,280 | $10,160 | $60,120 |
| 2017 | $2,000 | $66,300 | $8,700 | $57,600 |
| 2016 | $1,987 | $65,898 | $8,700 | $57,198 |
| 2015 | $2,036 | $67,394 | $10,196 | $57,198 |
| 2014 | $1,948 | $64,384 | $10,196 | $54,188 |
| 2013 | -- | $70,620 | $10,092 | $60,528 |
Source: Public Records
Map
Nearby Homes
- 104 Sweetgum Dr
- 1784 Mooty Bridge Rd
- 104 Englewood Dr
- 114 Red Oak Trail
- 502 Ashford Cir
- 102 Beech Creek Dr
- 103 Windridge
- 204 Dixie Creek Dr
- 103 Woodchase
- 91 Richmond Dr
- 107 Windridge
- 109 Windridge
- 209 River Oaks Dr
- 201 S Chilton Crescent
- 203 S Chilton Crescent
- 110 Pond View Point
- 732 Camellia Dr
- 724 Camellia Dr
- 106 Ewing St
- 134 S Page St
- 120 Ashling Dr
- 124 Ashling Dr
- 121 Ashling Dr
- 118 Ashling Dr
- 126 Ashling Dr
- 123 Ashling Dr
- 117 Saint Anthony Dr
- 121 Saint Anthony Dr
- 123 St Anthony Dr
- 119 Ashling Dr
- 125 Ashling Dr
- 117 St Anthony Dr
- 115 St Anthony Dr
- 128 Ashling Dr
- 116 Ashling Dr
- 127 Ashling Dr
- 113 Saint Anthony Dr
- 125 St Anthony Dr
- 104 Kildare Ct
- 109 Saint Anthony Dr
Your Personal Tour Guide
Ask me questions while you tour the home.