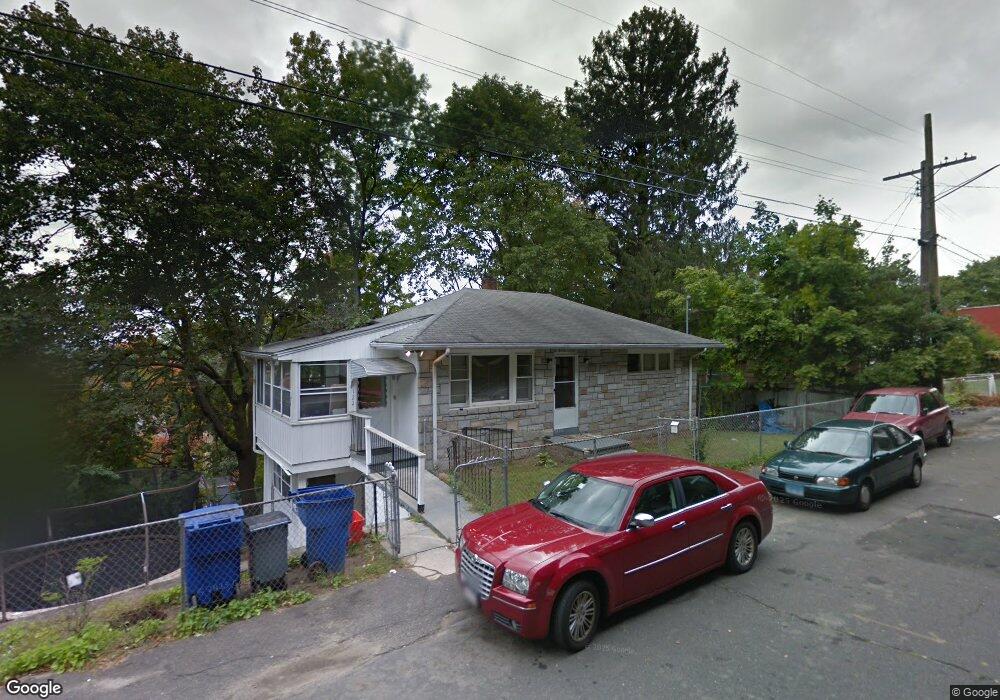
122 Beech St Waterbury, CT 06704
North End District NeighborhoodEstimated Value: $163,000 - $260,000
3
Beds
2
Baths
1,260
Sq Ft
$177/Sq Ft
Est. Value
About This Home
This home is located at 122 Beech St, Waterbury, CT 06704 and is currently estimated at $223,144, approximately $177 per square foot. 122 Beech St is a home located in New Haven County with nearby schools including Woodrow Wilson School, Michael F. Wallace Middle School, and Crosby High School.
Ownership History
Date
Name
Owned For
Owner Type
Purchase Details
Closed on
Mar 2, 2010
Sold by
Pnc Bk
Bought by
Galarza Wilbert J and Jimenez Nancy
Current Estimated Value
Purchase Details
Closed on
Sep 30, 2003
Sold by
Dimichele Domenic
Bought by
Buypal Lena
Home Financials for this Owner
Home Financials are based on the most recent Mortgage that was taken out on this home.
Original Mortgage
$75,375
Interest Rate
6.29%
Mortgage Type
Purchase Money Mortgage
Create a Home Valuation Report for This Property
The Home Valuation Report is an in-depth analysis detailing your home's value as well as a comparison with similar homes in the area
Home Values in the Area
Average Home Value in this Area
Purchase History
| Date | Buyer | Sale Price | Title Company |
|---|---|---|---|
| Galarza Wilbert J | $25,000 | -- | |
| Buypal Lena | $83,750 | -- |
Source: Public Records
Mortgage History
| Date | Status | Borrower | Loan Amount |
|---|---|---|---|
| Previous Owner | Buypal Lena | $77,000 | |
| Previous Owner | Buypal Lena | $75,375 |
Source: Public Records
Tax History Compared to Growth
Tax History
| Year | Tax Paid | Tax Assessment Tax Assessment Total Assessment is a certain percentage of the fair market value that is determined by local assessors to be the total taxable value of land and additions on the property. | Land | Improvement |
|---|---|---|---|---|
| 2025 | $4,795 | $106,610 | $11,340 | $95,270 |
| 2024 | $5,271 | $106,610 | $11,340 | $95,270 |
| 2023 | $5,777 | $106,610 | $11,340 | $95,270 |
| 2022 | $3,215 | $53,400 | $11,340 | $42,060 |
| 2021 | $3,215 | $53,400 | $11,340 | $42,060 |
| 2020 | $3,215 | $53,400 | $11,340 | $42,060 |
| 2019 | $3,215 | $53,400 | $11,340 | $42,060 |
| 2018 | $3,215 | $53,400 | $11,340 | $42,060 |
| 2017 | $4,212 | $69,950 | $11,340 | $58,610 |
| 2016 | $4,212 | $69,950 | $11,340 | $58,610 |
| 2015 | $4,072 | $69,950 | $11,340 | $58,610 |
| 2014 | $4,072 | $69,950 | $11,340 | $58,610 |
Source: Public Records
Map
Nearby Homes