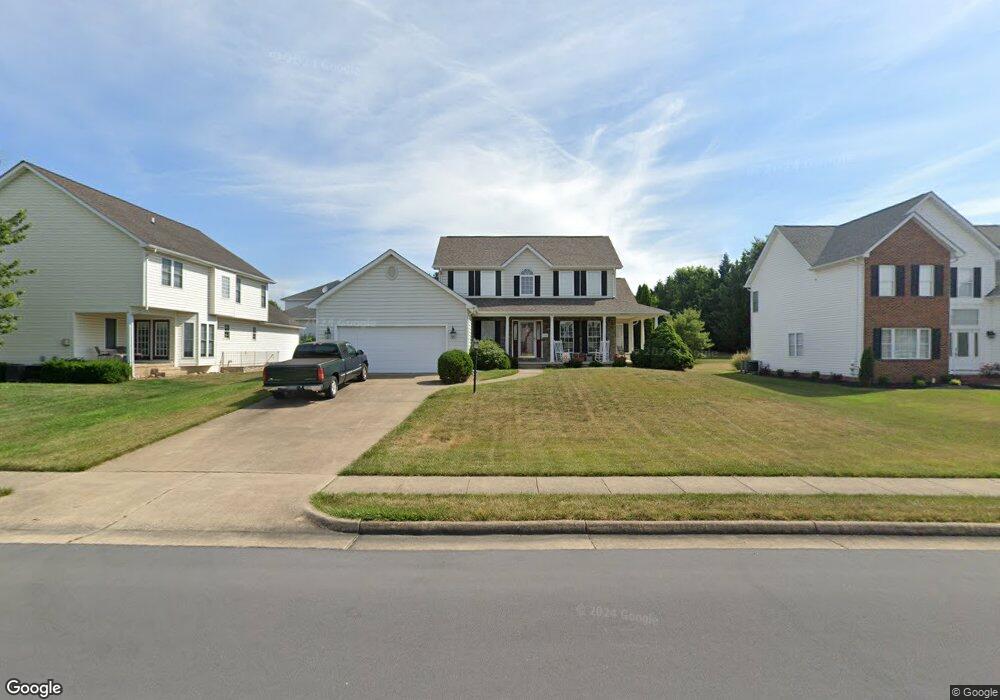
122 Branch Ct Stephens City, VA 22655
Estimated Value: $483,000 - $506,000
4
Beds
3
Baths
2,599
Sq Ft
$191/Sq Ft
Est. Value
About This Home
This home is located at 122 Branch Ct, Stephens City, VA 22655 and is currently estimated at $495,971, approximately $190 per square foot. 122 Branch Ct is a home located in Frederick County with nearby schools including Middletown Elementary School, Robert E. Aylor Middle School, and Sherando High School.
Ownership History
Date
Name
Owned For
Owner Type
Purchase Details
Closed on
Mar 11, 2011
Sold by
Costello Brendan M
Bought by
Bonnema Ronald E
Current Estimated Value
Home Financials for this Owner
Home Financials are based on the most recent Mortgage that was taken out on this home.
Original Mortgage
$207,920
Outstanding Balance
$143,131
Interest Rate
4.83%
Mortgage Type
New Conventional
Estimated Equity
$352,840
Purchase Details
Closed on
Jan 28, 2008
Sold by
Church Raymond E
Bought by
Costello Brendan E
Home Financials for this Owner
Home Financials are based on the most recent Mortgage that was taken out on this home.
Original Mortgage
$335,175
Interest Rate
6.17%
Mortgage Type
VA
Purchase Details
Closed on
Mar 10, 2000
Sold by
Eagle Place Industries In
Bought by
Haines Jason L
Home Financials for this Owner
Home Financials are based on the most recent Mortgage that was taken out on this home.
Original Mortgage
$175,900
Interest Rate
8.18%
Create a Home Valuation Report for This Property
The Home Valuation Report is an in-depth analysis detailing your home's value as well as a comparison with similar homes in the area
Home Values in the Area
Average Home Value in this Area
Purchase History
| Date | Buyer | Sale Price | Title Company |
|---|---|---|---|
| Bonnema Ronald E | $254,900 | -- | |
| Costello Brendan E | $337,900 | -- | |
| Haines Jason L | $219,900 | -- |
Source: Public Records
Mortgage History
| Date | Status | Borrower | Loan Amount |
|---|---|---|---|
| Open | Bonnema Ronald E | $207,920 | |
| Previous Owner | Costello Brendan E | $335,175 | |
| Previous Owner | Haines Jason L | $175,900 |
Source: Public Records
Tax History Compared to Growth
Tax History
| Year | Tax Paid | Tax Assessment Tax Assessment Total Assessment is a certain percentage of the fair market value that is determined by local assessors to be the total taxable value of land and additions on the property. | Land | Improvement |
|---|---|---|---|---|
| 2025 | $2,397 | $499,300 | $98,000 | $401,300 |
| 2024 | $998 | $391,500 | $82,000 | $309,500 |
| 2023 | $1,997 | $391,500 | $82,000 | $309,500 |
| 2022 | $1,988 | $325,900 | $77,000 | $248,900 |
| 2021 | $1,988 | $325,900 | $77,000 | $248,900 |
| 2020 | $1,857 | $304,500 | $77,000 | $227,500 |
| 2019 | $1,857 | $304,500 | $77,000 | $227,500 |
| 2018 | $1,767 | $289,600 | $77,000 | $212,600 |
| 2017 | $1,738 | $289,600 | $77,000 | $212,600 |
| 2016 | $1,598 | $266,300 | $64,500 | $201,800 |
| 2015 | $1,491 | $266,300 | $64,500 | $201,800 |
| 2014 | $702 | $246,200 | $64,500 | $181,700 |
Source: Public Records
Map
Nearby Homes
- 135 Trunk Dr
- 116 Barkwood Dr
- 153 Littlewing Way
- 127 Brandenbury Ct
- 0 Stickley Dr
- 100 Nottoway Dr
- 147 Westchester Dr
- 110 Nathan Dr
- 225 Nottoway Dr
- 214 Nottoway Dr
- 121 Harmon Place
- 127 Westchester Dr
- 100 Warren Cir
- Lot 1B Double Church Rd
- 712 Fairfax Pike
- 406 Carroll Dr
- 112 Jefferson Ct
- 5378 Main St
- 5342 Main St
- 135 Sherando Cir