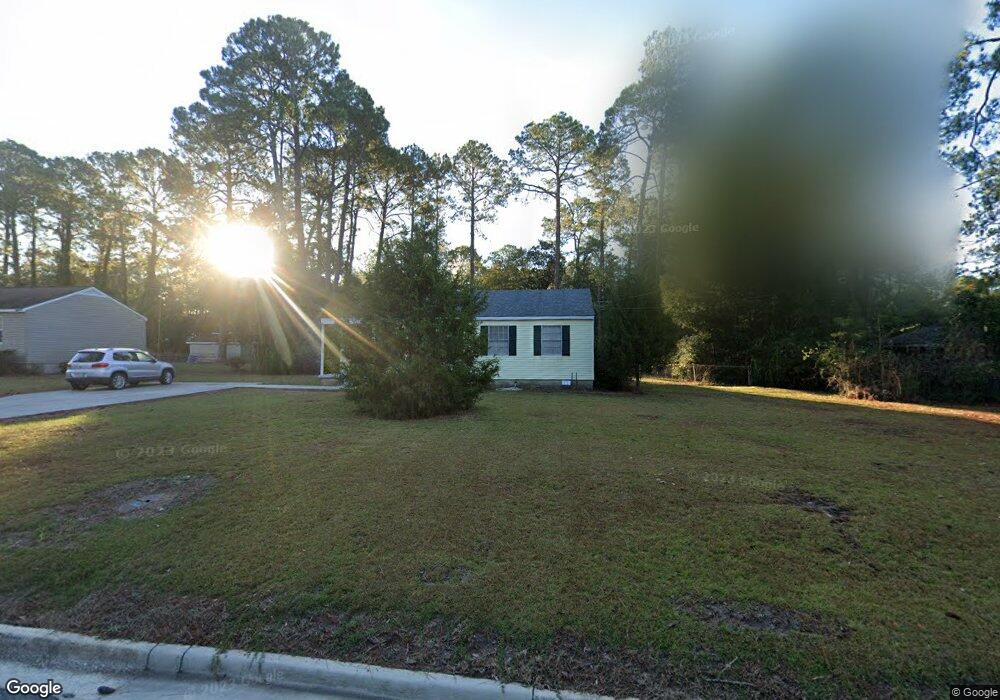
122 Branch St Tifton, GA 31794
Estimated Value: $125,000 - $173,000
2
Beds
2
Baths
1,307
Sq Ft
$116/Sq Ft
Est. Value
About This Home
This home is located at 122 Branch St, Tifton, GA 31794 and is currently estimated at $151,288, approximately $115 per square foot. 122 Branch St is a home located in Tift County with nearby schools including Len Lastinger Primary School, Charles Spencer Elementary School, and J.T. Reddick School.
Ownership History
Date
Name
Owned For
Owner Type
Purchase Details
Closed on
Apr 1, 2016
Sold by
Webb Betty Ruth
Bought by
Cnk Properties Llc
Current Estimated Value
Purchase Details
Closed on
Sep 15, 2009
Sold by
Harvey Eleanor F
Bought by
Webb Betty Ruth Betsy Harvey
Purchase Details
Closed on
Sep 1, 2009
Sold by
Harvey George R Pete
Bought by
Harvey Eleanor F
Purchase Details
Closed on
Jun 9, 1987
Sold by
Moore Emogene Herndon
Bought by
Harvey G R
Purchase Details
Closed on
Oct 31, 1964
Sold by
Ottis R Faulk Homes Inc
Bought by
Moore Moore A and Moore Emogene H
Create a Home Valuation Report for This Property
The Home Valuation Report is an in-depth analysis detailing your home's value as well as a comparison with similar homes in the area
Home Values in the Area
Average Home Value in this Area
Purchase History
| Date | Buyer | Sale Price | Title Company |
|---|---|---|---|
| Cnk Properties Llc | $40,000 | -- | |
| Webb Betty Ruth Betsy Harvey | -- | -- | |
| Harvey Eleanor F | -- | -- | |
| Harvey G R | $24,000 | -- | |
| Moore Moore A | $600 | -- |
Source: Public Records
Tax History Compared to Growth
Tax History
| Year | Tax Paid | Tax Assessment Tax Assessment Total Assessment is a certain percentage of the fair market value that is determined by local assessors to be the total taxable value of land and additions on the property. | Land | Improvement |
|---|---|---|---|---|
| 2024 | $1,172 | $43,478 | $12,000 | $31,478 |
| 2023 | $1,246 | $25,875 | $4,000 | $21,875 |
| 2022 | $974 | $25,875 | $4,000 | $21,875 |
| 2021 | $980 | $25,875 | $4,000 | $21,875 |
| 2020 | $1,004 | $25,875 | $4,000 | $21,875 |
| 2019 | $1,005 | $25,875 | $4,000 | $21,875 |
| 2018 | $1,005 | $25,875 | $4,000 | $21,875 |
| 2017 | $663 | $25,875 | $4,000 | $21,875 |
| 2016 | $921 | $27,030 | $4,000 | $23,030 |
| 2015 | $922 | $27,030 | $4,000 | $23,030 |
| 2014 | $923 | $27,030 | $4,000 | $23,030 |
| 2013 | -- | $27,030 | $4,000 | $23,030 |
Source: Public Records
Map
Nearby Homes
- 307 Fulwood Blvd
- 523 Alabama Dr Unit 15 & PT 16
- 523 Alabama Dr
- 225 Alabama Dr
- 0 N U S Hwy 41
- 711 10th St W
- 0 Penn Place
- 2202 Emory Dr
- 2021 Emory Dr
- 0 Lee Ball Rd
- 1601 Murray Ave
- 803 Forest Ave
- 803 Forrest Ave
- 821 Murray Ave
- 2609 Emmett Dr
- 1617 Wilson Ave N
- 0 US Highway 41 Unit 137727
- 1607 Mallard Ln
- 416 6th St W
- 1610 Mallard Ln
- 126 Branch St
- 120 Branch St
- 117 Woodruff St
- 114 Branch St
- 0 Branch St
- 121 Branch St
- 128 Branch St
- 129 Branch St
- 117 Branch St
- 113 Woodruff St
- 123 Woodruff St
- 110 Branch St
- 131 Branch St
- 113 Branch St
- 2120 Small
- 0 Club View Dr Unit 122684
- 0 Club View Dr Unit 122688
- 0 Club View Dr Unit 122687
- 0 Club View Dr Unit 122685
- 0 Clubview Dr Unit 122766