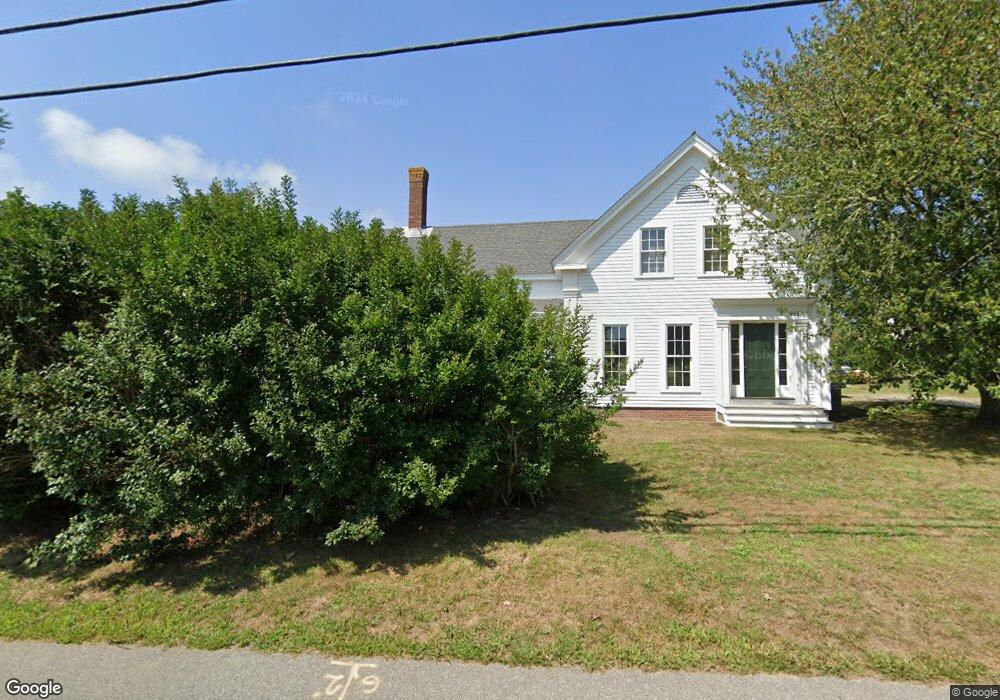
122 Cedar St Chatham, MA 02633
Chatham Village NeighborhoodEstimated Value: $2,297,998 - $3,635,000
5
Beds
4
Baths
2,696
Sq Ft
$1,019/Sq Ft
Est. Value
About This Home
This home is located at 122 Cedar St, Chatham, MA 02633 and is currently estimated at $2,746,750, approximately $1,018 per square foot. 122 Cedar St is a home located in Barnstable County with nearby schools including Chatham Elementary School, Harwich Elementary School, and Monomoy Regional Middle School.
Ownership History
Date
Name
Owned For
Owner Type
Purchase Details
Closed on
Jun 15, 2021
Sold by
Perkins Peter D and Perkins Katharine P
Bought by
Perkins Peter D and Perkins Katharine P
Current Estimated Value
Home Financials for this Owner
Home Financials are based on the most recent Mortgage that was taken out on this home.
Original Mortgage
$500,000
Outstanding Balance
$450,711
Interest Rate
2.9%
Mortgage Type
New Conventional
Estimated Equity
$2,296,039
Create a Home Valuation Report for This Property
The Home Valuation Report is an in-depth analysis detailing your home's value as well as a comparison with similar homes in the area
Home Values in the Area
Average Home Value in this Area
Purchase History
| Date | Buyer | Sale Price | Title Company |
|---|---|---|---|
| Perkins Peter D | -- | None Available | |
| Perkins Peter D | -- | None Available |
Source: Public Records
Mortgage History
| Date | Status | Borrower | Loan Amount |
|---|---|---|---|
| Open | Perkins Peter D | $500,000 | |
| Closed | Perkins Peter D | $500,000 |
Source: Public Records
Tax History Compared to Growth
Tax History
| Year | Tax Paid | Tax Assessment Tax Assessment Total Assessment is a certain percentage of the fair market value that is determined by local assessors to be the total taxable value of land and additions on the property. | Land | Improvement |
|---|---|---|---|---|
| 2025 | $7,945 | $2,289,700 | $1,203,700 | $1,086,000 |
| 2024 | $8,191 | $2,294,400 | $1,135,500 | $1,158,900 |
| 2023 | $6,288 | $1,620,700 | $946,200 | $674,500 |
| 2022 | $6,279 | $1,359,100 | $946,200 | $412,900 |
| 2021 | $5,870 | $1,178,800 | $802,700 | $376,100 |
| 2020 | $5,347 | $1,109,300 | $733,900 | $375,400 |
| 2019 | $4,896 | $1,009,500 | $686,100 | $323,400 |
| 2018 | $4,816 | $988,900 | $686,100 | $302,800 |
| 2017 | $4,852 | $964,600 | $666,000 | $298,600 |
| 2016 | $4,664 | $929,000 | $653,000 | $276,000 |
| 2015 | $4,504 | $902,600 | $634,500 | $268,100 |
| 2014 | $4,585 | $902,500 | $634,500 | $268,000 |
Source: Public Records
Map
Nearby Homes
- 85 Cedar St
- 287 Cedar St
- 292 Stage Harbor Rd
- 404 Stage Harbor Rd
- 58 Oyster Bluff
- 12 Pond St
- 99 Uncle Alberts Drive Extension
- 86 Champlain Rd
- 745 Main St
- 450 Main St
- 425 Main St Unit D
- 425 Main St Unit D
- 409 Main St
- 14 Pond View Ln
- 32 Sunset Ln
- 346 Morris Island Rd
- 36 Moonbeam Ln
- 3 Oyster Dr
- 213 Main St
- 27 Martha Kendrick Dr