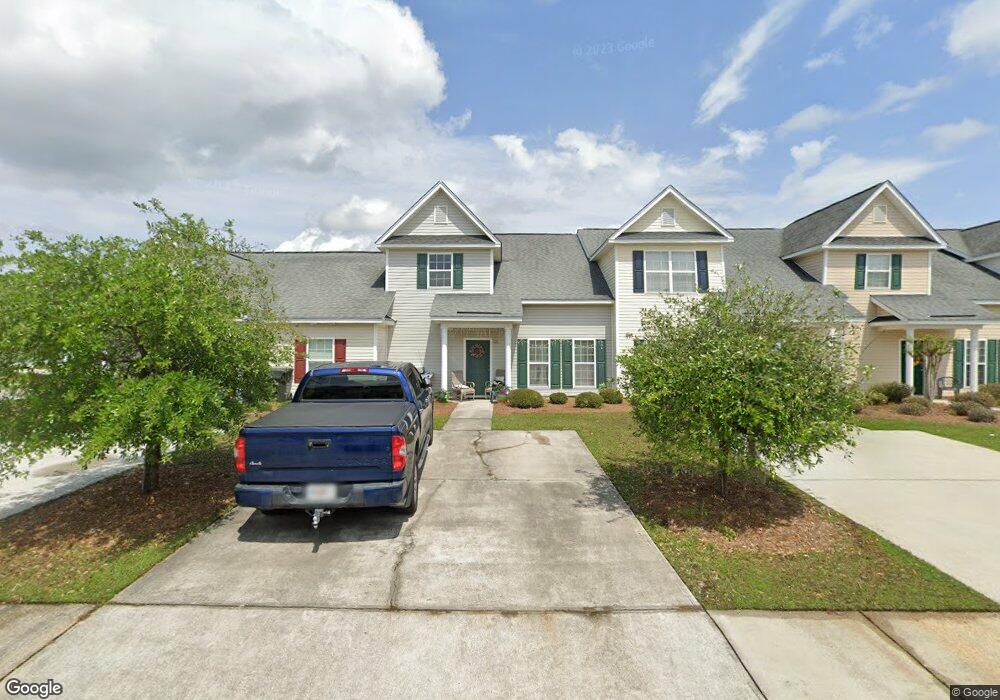
122 Cromer St Pooler, GA 31322
Godley Station NeighborhoodEstimated Value: $205,000 - $242,408
3
Beds
3
Baths
1,439
Sq Ft
$159/Sq Ft
Est. Value
About This Home
This home is located at 122 Cromer St, Pooler, GA 31322 and is currently estimated at $229,102, approximately $159 per square foot. 122 Cromer St is a home located in Chatham County with nearby schools including Godley Station School and Groves High School.
Ownership History
Date
Name
Owned For
Owner Type
Purchase Details
Closed on
Aug 23, 2024
Sold by
Allen Arlene F
Bought by
Reasen Rodney and Reasen Stephanie
Current Estimated Value
Home Financials for this Owner
Home Financials are based on the most recent Mortgage that was taken out on this home.
Original Mortgage
$172,000
Outstanding Balance
$139,502
Interest Rate
6.78%
Mortgage Type
New Conventional
Estimated Equity
$89,600
Purchase Details
Closed on
Mar 31, 2023
Sold by
Vargas Leonardo Torres
Bought by
Allen Arlene F and Garcia Sara R
Purchase Details
Closed on
Dec 29, 2017
Sold by
Vargas Leonardo Torres
Bought by
Vargas Leonardo Torres and Sepulveda Bedoya Gloria P
Home Financials for this Owner
Home Financials are based on the most recent Mortgage that was taken out on this home.
Original Mortgage
$127,645
Interest Rate
3.75%
Mortgage Type
FHA
Purchase Details
Closed on
Nov 10, 2011
Sold by
Luo Jimmy H
Bought by
Luo Jimmy H
Home Financials for this Owner
Home Financials are based on the most recent Mortgage that was taken out on this home.
Original Mortgage
$81,000
Interest Rate
4.17%
Mortgage Type
New Conventional
Purchase Details
Closed on
Nov 2, 2005
Sold by
Not Provided
Bought by
Luo Jimmy H
Create a Home Valuation Report for This Property
The Home Valuation Report is an in-depth analysis detailing your home's value as well as a comparison with similar homes in the area
Home Values in the Area
Average Home Value in this Area
Purchase History
| Date | Buyer | Sale Price | Title Company |
|---|---|---|---|
| Reasen Rodney | $215,000 | -- | |
| Allen Arlene F | $250,000 | -- | |
| Vargas Leonardo Torres | -- | -- | |
| Vargas Leonardo Torres | -- | -- | |
| Vargas Leonardo Torres | $130,000 | -- | |
| Luo Jimmy H | -- | -- | |
| Luo Jimmy H | $5,024,000 | -- |
Source: Public Records
Mortgage History
| Date | Status | Borrower | Loan Amount |
|---|---|---|---|
| Open | Reasen Rodney | $172,000 | |
| Previous Owner | Vargas Leonardo Torres | $127,645 | |
| Previous Owner | Luo Jimmy H | $81,000 |
Source: Public Records
Tax History Compared to Growth
Tax History
| Year | Tax Paid | Tax Assessment Tax Assessment Total Assessment is a certain percentage of the fair market value that is determined by local assessors to be the total taxable value of land and additions on the property. | Land | Improvement |
|---|---|---|---|---|
| 2025 | $2,945 | $81,680 | $16,000 | $65,680 |
| 2024 | $2,945 | $84,800 | $16,000 | $68,800 |
| 2023 | $1,982 | $67,880 | $16,000 | $51,880 |
| 2022 | $567 | $46,440 | $5,000 | $41,440 |
| 2021 | $1,781 | $40,440 | $5,000 | $35,440 |
| 2020 | $1,218 | $38,280 | $5,000 | $33,280 |
| 2019 | $1,713 | $38,560 | $5,000 | $33,560 |
| 2018 | $1,677 | $37,280 | $5,000 | $32,280 |
| 2017 | $1,339 | $37,480 | $5,000 | $32,480 |
| 2016 | $871 | $36,160 | $5,000 | $31,160 |
| 2015 | $1,352 | $36,840 | $5,000 | $31,840 |
| 2014 | $1,788 | $36,880 | $0 | $0 |
Source: Public Records
Map
Nearby Homes
- 105 Ballasalla Loop
- 237 Cromer St
- 236 Cromer St
- 252 Cromer St
- 274 Cromer St
- 279 Cromer St
- 148 Orkney Rd
- 116 Alexander Trail
- 283 Cromer St
- 176 Orkney Rd
- 175 Orkney Rd
- 213 Orkney Rd
- 193 Orkney Rd
- 195 Orkney Rd
- 191 Orkney Rd
- 7 Bridlington Way
- 4 Bridlington Way
- 168 Orkney Rd
- 222 Brookline Dr
- 198 Brookline Dr