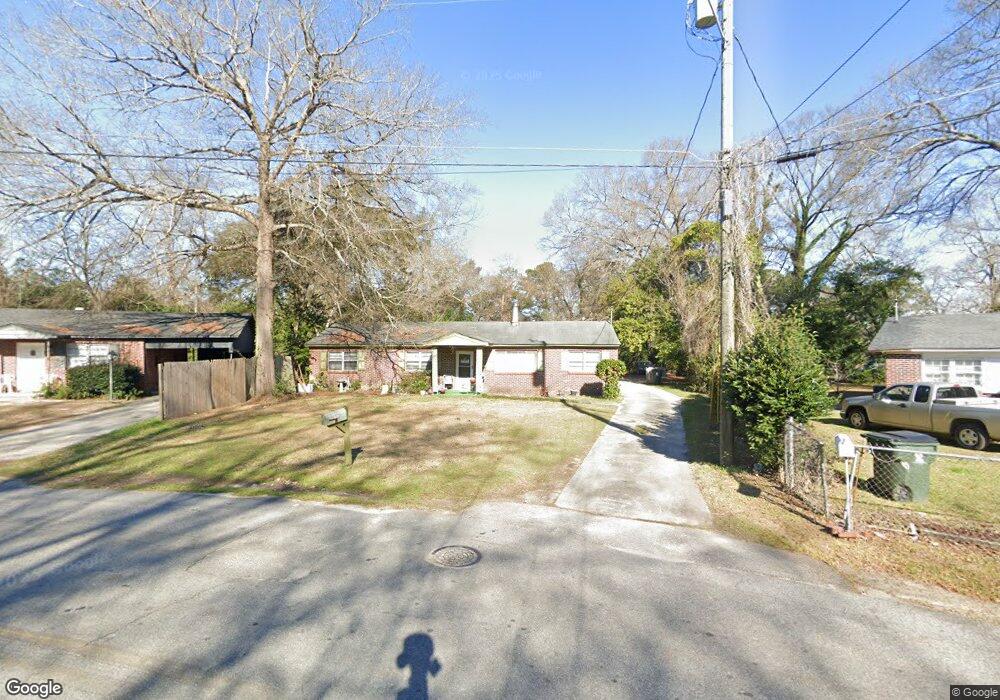
122 Flanders Dr Warner Robins, GA 31093
Estimated Value: $109,748 - $137,000
--
Bed
1
Bath
1,248
Sq Ft
$98/Sq Ft
Est. Value
About This Home
This home is located at 122 Flanders Dr, Warner Robins, GA 31093 and is currently estimated at $121,937, approximately $97 per square foot. 122 Flanders Dr is a home located in Houston County with nearby schools including Lindsey Elementary School, Northside Middle School, and Northside High School.
Ownership History
Date
Name
Owned For
Owner Type
Purchase Details
Closed on
Aug 27, 2003
Sold by
Smith Samuel
Bought by
Roberts Angela
Current Estimated Value
Purchase Details
Closed on
Aug 16, 2000
Sold by
Smith Susie M Estate
Bought by
Smith Samuel
Purchase Details
Closed on
Oct 10, 1984
Sold by
Harris James R and Harris Joann
Bought by
Smith Susie M
Purchase Details
Closed on
Nov 1, 1979
Sold by
Mclellan John T
Bought by
Harris James R and Harris Joann
Purchase Details
Closed on
Jun 25, 1968
Sold by
Erlandson Odean R
Bought by
Mclellan John T
Purchase Details
Closed on
Apr 15, 1968
Sold by
Willis Lillie E
Bought by
Erlandson Odean R
Purchase Details
Closed on
Jun 5, 1967
Sold by
Warren Maudie M
Bought by
Willis Lillie E
Purchase Details
Closed on
Jan 12, 1967
Sold by
Camp Warren L
Bought by
Warren Maudie M
Purchase Details
Closed on
May 10, 1961
Bought by
Camp Warren L
Create a Home Valuation Report for This Property
The Home Valuation Report is an in-depth analysis detailing your home's value as well as a comparison with similar homes in the area
Home Values in the Area
Average Home Value in this Area
Purchase History
| Date | Buyer | Sale Price | Title Company |
|---|---|---|---|
| Roberts Angela | -- | -- | |
| Smith Samuel | -- | -- | |
| Smith Susie M | -- | -- | |
| Harris James R | -- | -- | |
| Mclellan John T | -- | -- | |
| Erlandson Odean R | -- | -- | |
| Willis Lillie E | -- | -- | |
| Warren Maudie M | -- | -- | |
| Camp Warren L | -- | -- |
Source: Public Records
Tax History Compared to Growth
Tax History
| Year | Tax Paid | Tax Assessment Tax Assessment Total Assessment is a certain percentage of the fair market value that is determined by local assessors to be the total taxable value of land and additions on the property. | Land | Improvement |
|---|---|---|---|---|
| 2024 | $420 | $26,520 | $5,000 | $21,520 |
| 2023 | $466 | $20,520 | $2,640 | $17,880 |
| 2022 | $395 | $19,200 | $2,640 | $16,560 |
| 2021 | $336 | $16,520 | $2,640 | $13,880 |
| 2020 | $344 | $16,800 | $2,640 | $14,160 |
| 2019 | $344 | $16,800 | $2,640 | $14,160 |
| 2018 | $344 | $16,800 | $2,640 | $14,160 |
| 2017 | $344 | $16,800 | $2,640 | $14,160 |
| 2016 | $345 | $16,800 | $2,640 | $14,160 |
| 2015 | -- | $16,800 | $2,640 | $14,160 |
| 2014 | -- | $16,800 | $2,640 | $14,160 |
| 2013 | -- | $16,800 | $2,640 | $14,160 |
Source: Public Records
Map
Nearby Homes