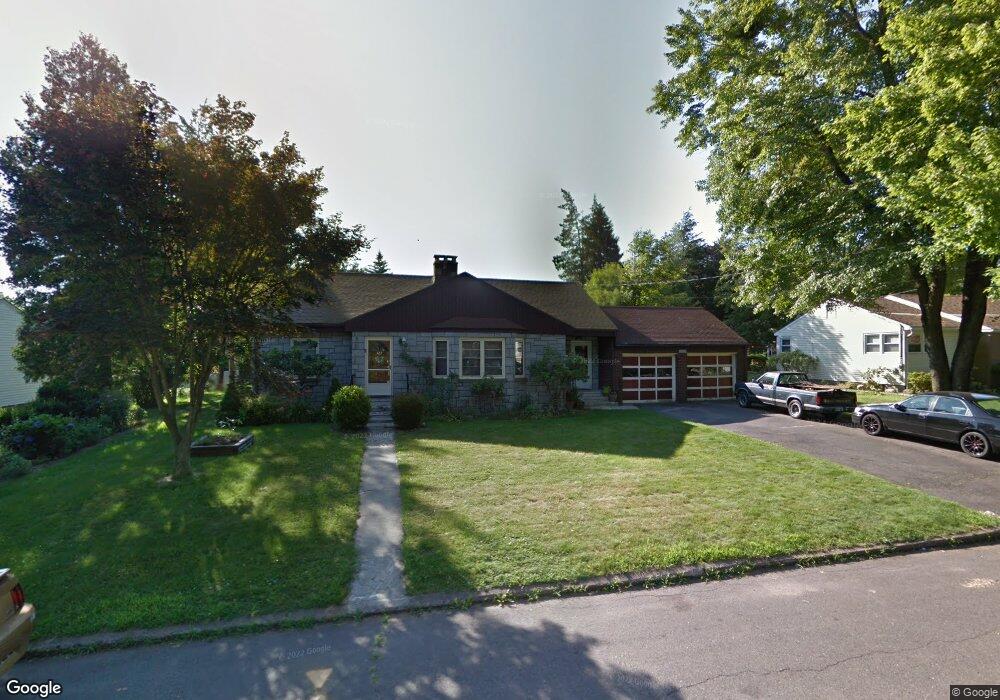
122 Grandview Ave Wallingford, CT 06492
Estimated Value: $523,000 - $737,908
5
Beds
5
Baths
3,310
Sq Ft
$192/Sq Ft
Est. Value
About This Home
This home is located at 122 Grandview Ave, Wallingford, CT 06492 and is currently estimated at $635,977, approximately $192 per square foot. 122 Grandview Ave is a home located in New Haven County with nearby schools including Evarts C. Stevens School, Pond Hill Elementary School, and Dag Hammarskjold Middle School.
Ownership History
Date
Name
Owned For
Owner Type
Purchase Details
Closed on
Sep 28, 2001
Sold by
Slocum John C and Slocum Margaret F
Bought by
Mcdonald John C
Current Estimated Value
Home Financials for this Owner
Home Financials are based on the most recent Mortgage that was taken out on this home.
Original Mortgage
$180,000
Interest Rate
6.91%
Purchase Details
Closed on
Apr 25, 1994
Sold by
Ragucci Frank D Est
Bought by
Slocum John C and Slocum Margaret F
Purchase Details
Closed on
Feb 4, 1991
Sold by
First Constitution Bk
Bought by
Peck John H
Purchase Details
Closed on
May 18, 1990
Sold by
Gimple Comm Sharon
Bought by
First Constitution Bk
Create a Home Valuation Report for This Property
The Home Valuation Report is an in-depth analysis detailing your home's value as well as a comparison with similar homes in the area
Home Values in the Area
Average Home Value in this Area
Purchase History
| Date | Buyer | Sale Price | Title Company |
|---|---|---|---|
| Mcdonald John C | $200,000 | -- | |
| Mcdonald John C | $200,000 | -- | |
| Slocum John C | $156,500 | -- | |
| Slocum John C | $156,500 | -- | |
| Peck John H | $137,500 | -- | |
| Peck John H | $137,500 | -- | |
| First Constitution Bk | $135,000 | -- |
Source: Public Records
Mortgage History
| Date | Status | Borrower | Loan Amount |
|---|---|---|---|
| Open | First Constitution Bk | $310,500 | |
| Closed | First Constitution Bk | $180,000 |
Source: Public Records
Tax History Compared to Growth
Tax History
| Year | Tax Paid | Tax Assessment Tax Assessment Total Assessment is a certain percentage of the fair market value that is determined by local assessors to be the total taxable value of land and additions on the property. | Land | Improvement |
|---|---|---|---|---|
| 2025 | $13,927 | $577,400 | $102,000 | $475,400 |
| 2024 | $10,538 | $343,700 | $90,200 | $253,500 |
| 2023 | $6,537 | $222,800 | $90,200 | $132,600 |
| 2022 | $6,470 | $222,800 | $90,200 | $132,600 |
| 2021 | $6,354 | $222,800 | $90,200 | $132,600 |
| 2020 | $6,740 | $230,900 | $97,800 | $133,100 |
| 2019 | $6,740 | $230,900 | $97,800 | $133,100 |
| 2018 | $6,613 | $230,900 | $97,800 | $133,100 |
| 2017 | $6,592 | $230,900 | $97,800 | $133,100 |
| 2016 | $6,440 | $230,900 | $97,800 | $133,100 |
| 2015 | $6,670 | $242,800 | $97,800 | $145,000 |
| 2014 | $6,529 | $242,800 | $97,800 | $145,000 |
Source: Public Records
Map
Nearby Homes
- 120 Grandview Ave
- 333 S Elm St
- 91 Pond Hill Rd
- 210 S Elm St
- 180 S Whittlesey Ave
- 109 Clifton St
- 15 Marshall St
- 341 Long Hill Rd
- 6 Holly Ln
- 120 S Cherry St
- 67 Spring St
- 26 West St
- 32 Brian Rd
- 148 Judd Square Unit 148
- 39 Hoffman Ct Unit B3
- 530 Center St Unit C1
- 43 Academy St
- 85 N Colony St
- 513 Pilgrim Harbor
- 129 Brentwood Dr
- 124 Grandview Ave
- 4 Lincoln Dr
- 15 Atkinson Ln
- 11 Atkinson Ln
- 116 Grandview Ave
- 16 Lincoln Dr
- 6 Lincoln Dr
- 111 Grandview Ave
- 109 Grandview Ave
- 14 Lincoln Dr
- 113 Grandview Ave
- 107 Grandview Ave
- 8 Lincoln Dr
- 114 Grandview Ave
- 125 Grandview Ave
- 52 Lincoln Ave
- 4 Grandview Ct
- 16 Atkinson Ln
- 11 Grandview Ct
- 105 Grandview Ave