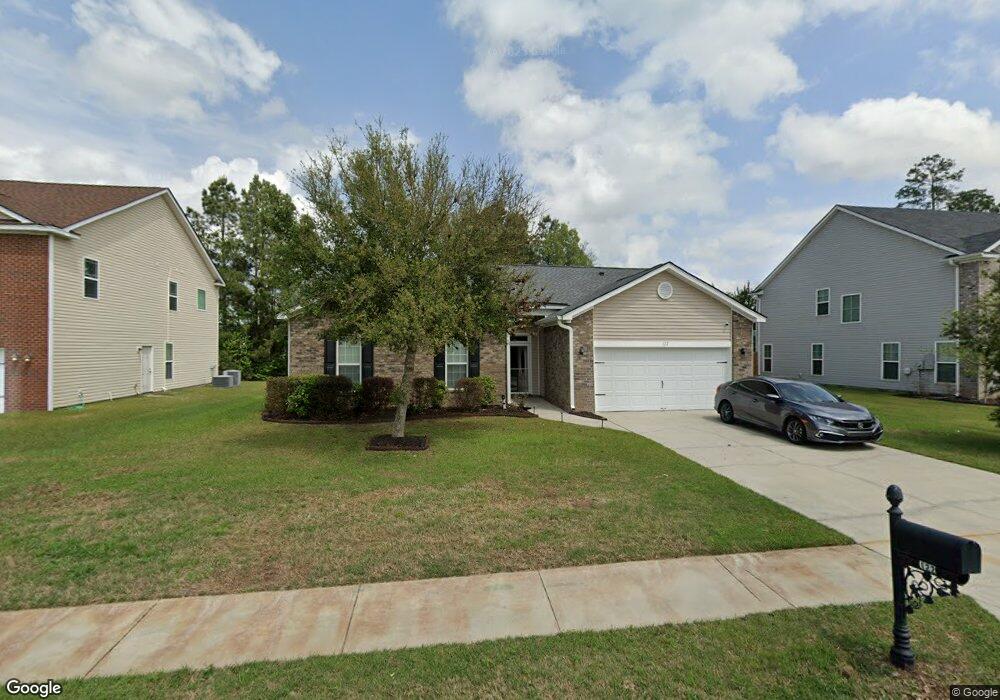
122 Greyfield Cir Pooler, GA 31322
Godley Station NeighborhoodEstimated Value: $316,000 - $360,000
3
Beds
2
Baths
1,461
Sq Ft
$228/Sq Ft
Est. Value
About This Home
This home is located at 122 Greyfield Cir, Pooler, GA 31322 and is currently estimated at $333,500, approximately $228 per square foot. 122 Greyfield Cir is a home located in Chatham County with nearby schools including Godley Station School, Groves High School, and Savannah Adventist Christian School.
Ownership History
Date
Name
Owned For
Owner Type
Purchase Details
Closed on
May 2, 2025
Sold by
Bolden Brandi N
Bought by
Hogue Christopher Lee and Hogue Krystin Elizabeth
Current Estimated Value
Home Financials for this Owner
Home Financials are based on the most recent Mortgage that was taken out on this home.
Original Mortgage
$300,000
Outstanding Balance
$298,936
Interest Rate
6.64%
Mortgage Type
FHA
Estimated Equity
$34,564
Purchase Details
Closed on
May 21, 2015
Sold by
Foley Brad T
Bought by
Bolden Brandi N
Home Financials for this Owner
Home Financials are based on the most recent Mortgage that was taken out on this home.
Original Mortgage
$173,655
Interest Rate
3.77%
Mortgage Type
VA
Purchase Details
Closed on
Jun 19, 2009
Sold by
Srh Investments Llc
Bought by
Foley Brad T and Newberry Natalie B
Home Financials for this Owner
Home Financials are based on the most recent Mortgage that was taken out on this home.
Original Mortgage
$171,942
Interest Rate
4.79%
Mortgage Type
FHA
Purchase Details
Closed on
Mar 3, 2006
Sold by
Not Provided
Bought by
T Foley and Newberry T
Create a Home Valuation Report for This Property
The Home Valuation Report is an in-depth analysis detailing your home's value as well as a comparison with similar homes in the area
Home Values in the Area
Average Home Value in this Area
Purchase History
| Date | Buyer | Sale Price | Title Company |
|---|---|---|---|
| Hogue Christopher Lee | $330,000 | -- | |
| Bolden Brandi N | $170,000 | -- | |
| Foley Brad T | $175,115 | -- | |
| T Foley | $1,443,000 | -- |
Source: Public Records
Mortgage History
| Date | Status | Borrower | Loan Amount |
|---|---|---|---|
| Open | Hogue Christopher Lee | $300,000 | |
| Previous Owner | Bolden Brandi N | $173,655 | |
| Previous Owner | Foley Brad T | $171,942 |
Source: Public Records
Tax History
| Year | Tax Paid | Tax Assessment Tax Assessment Total Assessment is a certain percentage of the fair market value that is determined by local assessors to be the total taxable value of land and additions on the property. | Land | Improvement |
|---|---|---|---|---|
| 2025 | $890 | $103,160 | $26,000 | $77,160 |
| 2024 | $9 | $90,720 | $26,000 | $64,720 |
| 2023 | $871 | $94,320 | $26,000 | $68,320 |
| 2022 | $1,732 | $71,880 | $18,000 | $53,880 |
| 2021 | $2,535 | $63,840 | $18,000 | $45,840 |
| 2020 | $1,788 | $62,480 | $18,000 | $44,480 |
| 2019 | $2,614 | $66,560 | $18,000 | $48,560 |
| 2018 | $1,765 | $64,640 | $18,000 | $46,640 |
| 2017 | $1,606 | $65,000 | $18,000 | $47,000 |
| 2016 | $1,554 | $59,560 | $13,200 | $46,360 |
| 2015 | $2,507 | $60,120 | $13,200 | $46,920 |
| 2014 | $3,457 | $60,760 | $0 | $0 |
Source: Public Records
Map
Nearby Homes
- 163 Willow Point Cir
- 158 Willow Point Cir
- 149 Willow Point Cir
- 171 Greyfield Cir
- 153 Greyfield Cir
- 44 Winter Lake Cir
- 190 Willow Point Cir
- 142 Willow Point Cir
- 218 Willow Point Ln
- 100 Cumberland Way
- 203 Lakepointe Dr
- 2 Havasu Lake Dr
- 123 Wind Willow Dr
- 194 Brickhill Cir
- 16 Millwood Lake Dr
- 256 Lakepointe Dr
- 106 Wind Willow Dr
- 54 Brookhaven Dr
- 225 Willow Point Cir
- 6 Spring Lake Cir
- 120 Greyfield Cir
- 124 Greyfield Cir
- 121 Greyfield Cir
- 121 Greyfield Cir
- 126 Greyfield Cir
- 118 Greyfield Cir
- 119 Greyfield Cir
- 119 Greyfield Cir
- 166 Willow Point Cir
- 123 Greyfield Cir
- 168 Willow Point Cir
- 164 Willow Point Cir
- 117 Greyfield Cir
- 117 Greyfield Cir
- 168 Willow Point Cir
- 116 Greyfield Cir
- 116 Greyfield Cir
- 125 Greyfield Cir
- 162 Willow Point Cir
- 128 Greyfield Cir
Your Personal Tour Guide
Ask me questions while you tour the home.