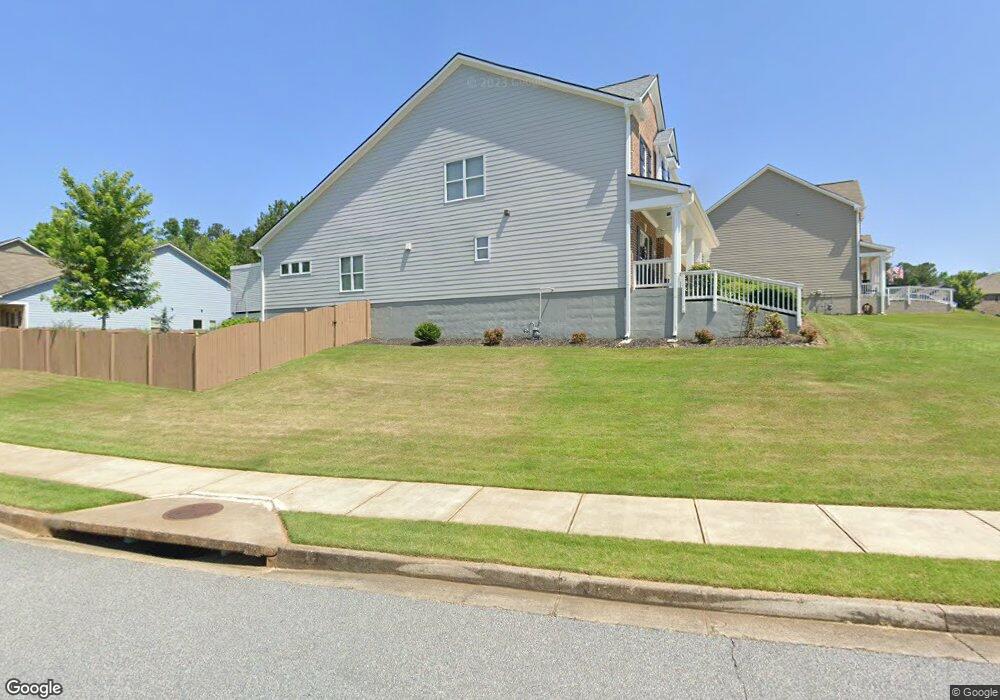
122 Hale View Cir Unit 94A Canton, GA 30114
Sutallee NeighborhoodEstimated Value: $643,000
4
Beds
3
Baths
3,087
Sq Ft
$208/Sq Ft
Est. Value
About This Home
This home is located at 122 Hale View Cir Unit 94A, Canton, GA 30114 and is currently estimated at $643,000, approximately $208 per square foot. 122 Hale View Cir Unit 94A is a home located in Cherokee County with nearby schools including Sixes Elementary School, Freedom Middle School, and Woodstock High School.
Ownership History
Date
Name
Owned For
Owner Type
Purchase Details
Closed on
Sep 21, 2018
Sold by
Shade Jeffrey Dennis
Bought by
Andretta Robert A and Andretta Nancy E
Current Estimated Value
Home Financials for this Owner
Home Financials are based on the most recent Mortgage that was taken out on this home.
Original Mortgage
$323,665
Outstanding Balance
$281,090
Interest Rate
4.5%
Mortgage Type
New Conventional
Estimated Equity
$361,910
Purchase Details
Closed on
Aug 26, 2014
Sold by
The Ryland Grp Inc
Bought by
Shade Jeffrey Dennis and Shade Jami L
Home Financials for this Owner
Home Financials are based on the most recent Mortgage that was taken out on this home.
Original Mortgage
$242,272
Interest Rate
4.12%
Mortgage Type
FHA
Create a Home Valuation Report for This Property
The Home Valuation Report is an in-depth analysis detailing your home's value as well as a comparison with similar homes in the area
Home Values in the Area
Average Home Value in this Area
Purchase History
| Date | Buyer | Sale Price | Title Company |
|---|---|---|---|
| Andretta Robert A | $340,700 | -- | |
| Shade Jeffrey Dennis | $246,743 | -- |
Source: Public Records
Mortgage History
| Date | Status | Borrower | Loan Amount |
|---|---|---|---|
| Open | Andretta Robert A | $323,665 | |
| Previous Owner | Shade Jeffrey Dennis | $242,272 |
Source: Public Records
Tax History Compared to Growth
Tax History
| Year | Tax Paid | Tax Assessment Tax Assessment Total Assessment is a certain percentage of the fair market value that is determined by local assessors to be the total taxable value of land and additions on the property. | Land | Improvement |
|---|---|---|---|---|
| 2025 | $1,334 | $247,080 | $50,000 | $197,080 |
| 2024 | $1,827 | $230,360 | $50,000 | $180,360 |
| 2023 | $1,426 | $226,680 | $48,000 | $178,680 |
| 2022 | $1,118 | $159,880 | $32,000 | $127,880 |
| 2021 | $1,162 | $148,320 | $29,520 | $118,800 |
| 2020 | $1,116 | $135,000 | $26,600 | $108,400 |
| 2019 | $1,084 | $126,560 | $23,200 | $103,360 |
| 2018 | $3,296 | $121,920 | $23,200 | $98,720 |
| 2017 | $3,189 | $301,200 | $23,200 | $97,280 |
| 2016 | $3,189 | $287,600 | $17,480 | $97,560 |
| 2015 | $2,835 | $246,800 | $17,480 | $81,240 |
| 2014 | $103 | $8,700 | $3,480 | $0 |
Source: Public Records
Map
Nearby Homes
- 238 Parc Dr
- 109 Hale View Cir
- 265 Parc Dr
- 8014 Bells Ferry Rd
- 552 Steels Bridge Rd
- 211 Parc Dr
- Jasper II Plan at Cambridge at Steels Bridge
- Newton II Plan at Cambridge at Steels Bridge
- Fulton II Plan at Cambridge at Steels Bridge
- Brookwood Plan at Cambridge at Steels Bridge
- Tifton II Plan at Cambridge at Steels Bridge
- 160 Henley St Unit 15
- 160 Henley St
- 164 Henley St
- 331 Laurel Glen Crossing
- 3008 Heatherbrook Trace Unit 2B
- 3021 Heatherbrook Trace
- 3018 Heatherbrook Trace
- 509 Wooten Dr
- 122 Hale View Cir
- 118 Hale View Cir
- 130 Hale View Cir
- 116 Hale View Cir
- 127 Hale View Cir
- 132 Hale View Cir
- 125 Hale View Cir
- 129 Hale View Cir
- 119 Hale View Cir
- 114 Hale View Cir
- 123 Hale View Cir
- 131 Hale View Cir
- 121 Hale View Cir
- 117 Hale View Cir
- 134 Hale View Cir
- 115 Hale View Cir
- 133 Hale View Cir
- 112 Hale View Cir
- 240 Parc Dr
- 113 Hale View Cir