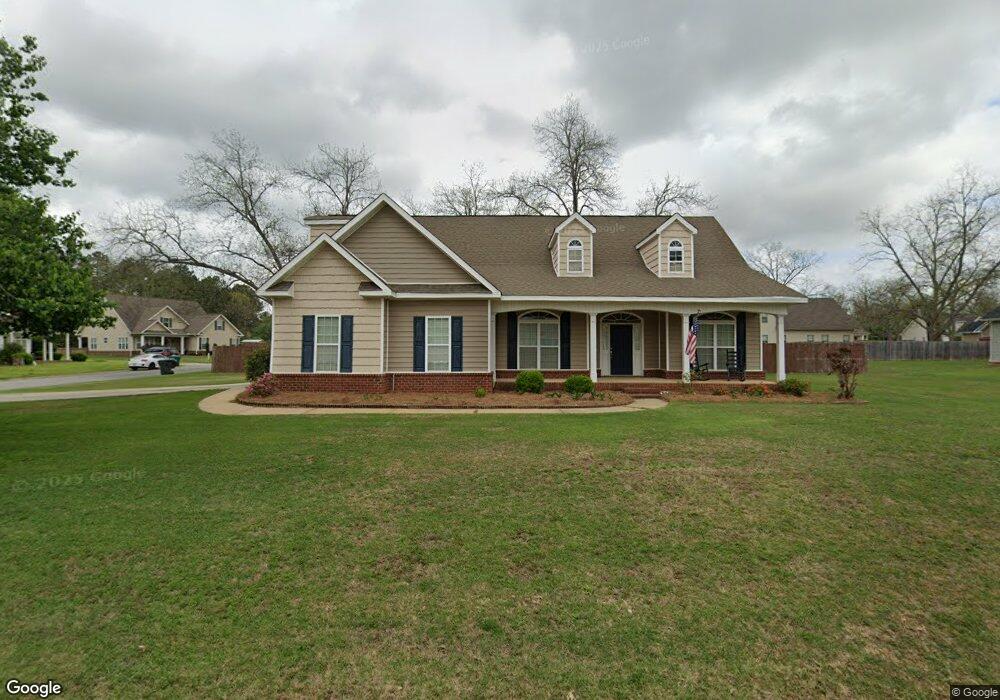
122 Lanier Loop Kathleen, GA 31047
Estimated Value: $308,678 - $335,000
3
Beds
3
Baths
2,018
Sq Ft
$160/Sq Ft
Est. Value
About This Home
This home is located at 122 Lanier Loop, Kathleen, GA 31047 and is currently estimated at $321,920, approximately $159 per square foot. 122 Lanier Loop is a home located in Houston County with nearby schools including Matthew Arthur Elementary School, Perry Middle School, and Veterans High School.
Ownership History
Date
Name
Owned For
Owner Type
Purchase Details
Closed on
Oct 28, 2005
Sold by
Murphy Will
Bought by
Jones Larry W and Jo Ann S*
Current Estimated Value
Purchase Details
Closed on
Jun 16, 2005
Sold by
Brittco Builders Llc
Bought by
Murphy Will
Home Financials for this Owner
Home Financials are based on the most recent Mortgage that was taken out on this home.
Original Mortgage
$148,000
Interest Rate
5.66%
Mortgage Type
Purchase Money Mortgage
Purchase Details
Closed on
Apr 21, 2005
Sold by
Sctc Development Llc
Bought by
Brittco Builders Llc
Home Financials for this Owner
Home Financials are based on the most recent Mortgage that was taken out on this home.
Original Mortgage
$148,000
Interest Rate
5.66%
Mortgage Type
Purchase Money Mortgage
Purchase Details
Closed on
Mar 30, 2005
Sold by
Eagle Springs Llc
Bought by
Sctc Development Llc
Create a Home Valuation Report for This Property
The Home Valuation Report is an in-depth analysis detailing your home's value as well as a comparison with similar homes in the area
Home Values in the Area
Average Home Value in this Area
Purchase History
| Date | Buyer | Sale Price | Title Company |
|---|---|---|---|
| Jones Larry W | $195,900 | -- | |
| Murphy Will | $35,300 | None Available | |
| Brittco Builders Llc | $33,000 | -- | |
| Sctc Development Llc | $32,000 | -- |
Source: Public Records
Mortgage History
| Date | Status | Borrower | Loan Amount |
|---|---|---|---|
| Previous Owner | Murphy Will | $148,000 |
Source: Public Records
Tax History
| Year | Tax Paid | Tax Assessment Tax Assessment Total Assessment is a certain percentage of the fair market value that is determined by local assessors to be the total taxable value of land and additions on the property. | Land | Improvement |
|---|---|---|---|---|
| 2025 | $2,127 | $106,520 | $16,000 | $90,520 |
| 2024 | $2,327 | $106,360 | $16,000 | $90,360 |
| 2023 | $1,935 | $89,160 | $16,000 | $73,160 |
| 2022 | $1,943 | $82,400 | $16,000 | $66,400 |
| 2021 | $1,803 | $76,200 | $16,000 | $60,200 |
| 2020 | $1,759 | $74,080 | $16,000 | $58,080 |
| 2019 | $1,759 | $74,080 | $16,000 | $58,080 |
| 2018 | $1,759 | $74,080 | $16,000 | $58,080 |
| 2017 | $1,761 | $74,080 | $16,000 | $58,080 |
| 2016 | $1,764 | $74,080 | $16,000 | $58,080 |
| 2015 | $1,767 | $74,080 | $16,000 | $58,080 |
| 2014 | -- | $74,080 | $16,000 | $58,080 |
| 2013 | -- | $80,440 | $16,000 | $64,440 |
Source: Public Records
Map
Nearby Homes
- 162 Talton Rd
- 160 Talton Rd
- 214 Old Hollow Way
- 170 Talton Rd
- 230 Old Hollow Way
- 235 Old Hollow Way
- 110 Rolling Meadow Way
- 271 Bear Branch Rd
- 232 Old Hollow Way
- 269 Bear Branch Rd
- 204 Amberley Ct
- 207 Amberley Ct
- 203 Amberley Ct
- 438 Newport Ave
- 123 Amberley Ct
- 110 Bella Ct
- 105 Bella Ct
- 323 Grand Reserve Way
- 112 Parkview Grove
- 202 Greythorne Dr
- 124 Lanier Loop
- 126 Lanier Loop
- 118 Lanier Loop Unit 4
- 118 Lanier Loop
- 129 Lanier Loop
- 127 Lanier Loop
- 212 Candler Dr
- 125 Lanier Loop
- 131 Lanier Loop
- 128 Lanier Loop
- 213 Candler Dr
- 116 Lanier Loop
- 123 Lanier Loop
- 135 Lanier Loop
- 133 Lanier Loop
- 137 Lanier Loop
- 210 Candler Dr
- 114 Lanier Loop
- 130 Lanier Loop
- 139 Lanier Loop
Your Personal Tour Guide
Ask me questions while you tour the home.