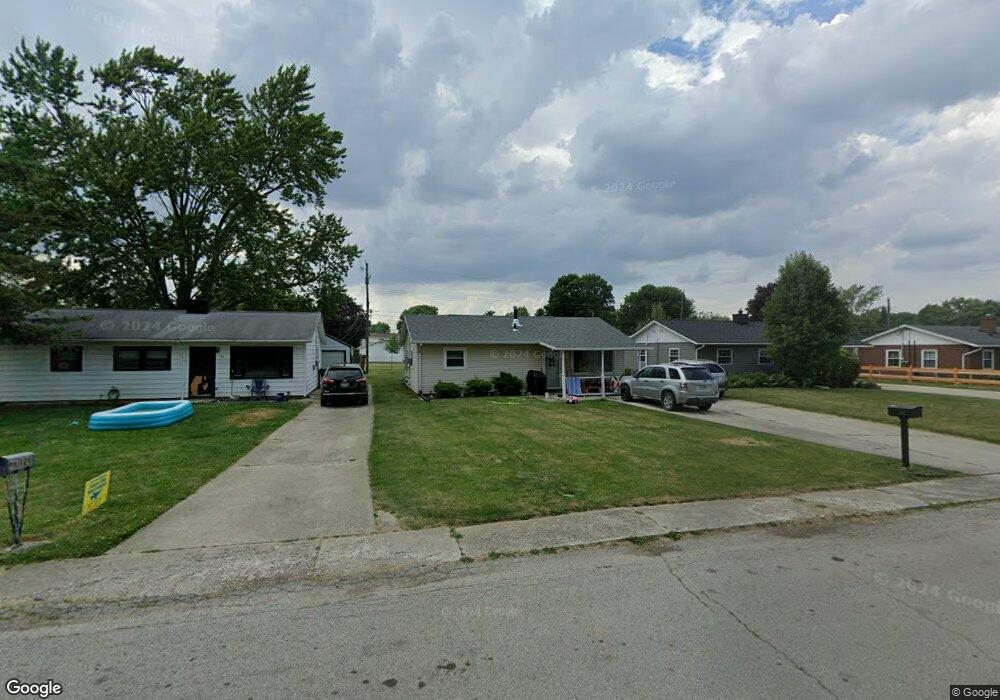
122 Longfellow Dr Tiffin, OH 44883
Estimated Value: $114,052 - $142,000
3
Beds
1
Bath
900
Sq Ft
$141/Sq Ft
Est. Value
About This Home
This home is located at 122 Longfellow Dr, Tiffin, OH 44883 and is currently estimated at $127,013, approximately $141 per square foot. 122 Longfellow Dr is a home located in Seneca County with nearby schools including Columbian High School, Calvert Catholic Elementary School, and Calvert High School.
Ownership History
Date
Name
Owned For
Owner Type
Purchase Details
Closed on
Mar 11, 2025
Sold by
Benner Margaret R
Bought by
Perkins Carrie M
Current Estimated Value
Purchase Details
Closed on
Mar 20, 2015
Sold by
Mrb Rentals Llc
Bought by
Benner Margaret R
Purchase Details
Closed on
Oct 8, 2009
Sold by
Lidster Geraldine F and Depinet James
Bought by
Mrb Rentals Llc
Home Financials for this Owner
Home Financials are based on the most recent Mortgage that was taken out on this home.
Original Mortgage
$31,600
Interest Rate
5.1%
Mortgage Type
Future Advance Clause Open End Mortgage
Purchase Details
Closed on
Sep 30, 2002
Sold by
Lidster Kenneth O
Bought by
Lidster Geraldine F
Purchase Details
Closed on
May 8, 2002
Sold by
Lidster Kenneth O
Bought by
Lidster Kenneth O
Create a Home Valuation Report for This Property
The Home Valuation Report is an in-depth analysis detailing your home's value as well as a comparison with similar homes in the area
Home Values in the Area
Average Home Value in this Area
Purchase History
| Date | Buyer | Sale Price | Title Company |
|---|---|---|---|
| Perkins Carrie M | -- | None Listed On Document | |
| Benner Margaret R | -- | Attorney | |
| Mrb Rentals Llc | $39,500 | None Available | |
| Lidster Geraldine F | -- | -- | |
| Lidster Kenneth O | -- | -- |
Source: Public Records
Mortgage History
| Date | Status | Borrower | Loan Amount |
|---|---|---|---|
| Previous Owner | Mrb Rentals Llc | $31,600 |
Source: Public Records
Tax History
| Year | Tax Paid | Tax Assessment Tax Assessment Total Assessment is a certain percentage of the fair market value that is determined by local assessors to be the total taxable value of land and additions on the property. | Land | Improvement |
|---|---|---|---|---|
| 2025 | $825 | $23,750 | $4,410 | $19,340 |
| 2024 | $821 | $23,750 | $4,410 | $19,340 |
| 2023 | $1,119 | $23,750 | $4,410 | $19,340 |
| 2022 | $670 | $16,070 | $3,680 | $12,390 |
| 2021 | $836 | $16,070 | $3,680 | $12,390 |
| 2020 | $688 | $16,062 | $3,675 | $12,387 |
| 2019 | $915 | $15,043 | $3,528 | $11,515 |
| 2018 | $667 | $15,043 | $3,528 | $11,515 |
| 2017 | $675 | $15,043 | $3,528 | $11,515 |
| 2016 | $593 | $13,545 | $3,780 | $9,765 |
| 2015 | $587 | $13,545 | $3,780 | $9,765 |
| 2014 | $538 | $13,545 | $3,780 | $9,765 |
| 2013 | $576 | $13,965 | $3,899 | $10,066 |
Source: Public Records
Map
Nearby Homes
- 795 S Sandusky St
- 106 Sycamore Woods Ln
- 0 County Road 54 Unit 226002523
- 0 County Road 54 Unit 10003456
- 0 County Road 54 Unit 20260272
- 499 W Williamsburg Dr
- 314 S Sandusky St
- 0 W Market St
- 49 2nd St
- 2465 S County Road 19
- 335 Benner St
- 376 W Perry St
- 311 W Perry St
- 88 Sycamore St
- 20 Lelar St
- 2695 Ohio 18
- 212 Benner St
- 489 Hedges St
- 0 Miami St Unit 10003054
- 0 Miami St Unit Parcel 2
- 128 Longfellow Dr
- 109 Gail Ln
- 116 Longfellow Dr
- 132 Longfellow Dr
- 110 Longfellow Dr
- 138 Longfellow Dr
- 104 Longfellow Dr
- 125 Longfellow Dr
- 121 Longfellow Dr
- 131 Longfellow Dr
- 115 Longfellow Dr
- 144 Longfellow Dr
- 137 Longfellow Dr
- 137 Longfellow Dr
- 107 Longfellow Dr
- 100 Longfellow Dr
- 148 Longfellow Dr
- 97 Gail Ln
- 103 Longfellow Dr
- 143 Longfellow Dr
Your Personal Tour Guide
Ask me questions while you tour the home.