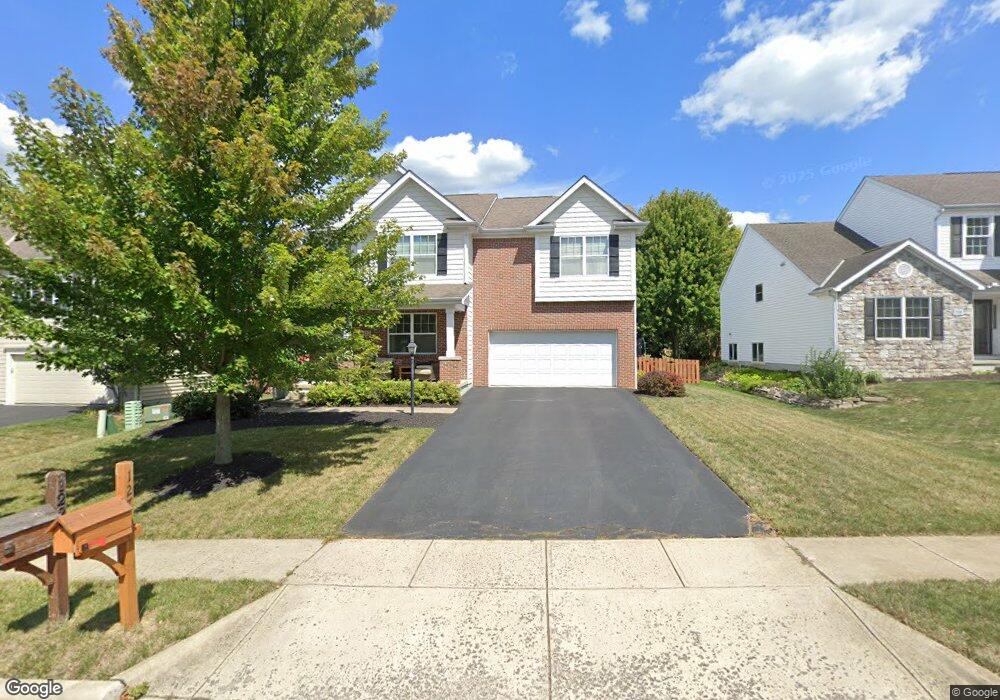
122 Longleaf St Unit 229 Pickerington, OH 43147
Estimated Value: $423,310 - $467,000
4
Beds
3
Baths
2,050
Sq Ft
$218/Sq Ft
Est. Value
About This Home
This home is located at 122 Longleaf St Unit 229, Pickerington, OH 43147 and is currently estimated at $446,578, approximately $217 per square foot. 122 Longleaf St Unit 229 is a home located in Fairfield County with nearby schools including Sycamore Creek Elementary School, Diley Middle School, and Pickerington Ridgeview Junior High School.
Ownership History
Date
Name
Owned For
Owner Type
Purchase Details
Closed on
Jan 2, 2018
Sold by
Courlin Properties Llc
Bought by
Weber Michael J and Weber Amanda M
Current Estimated Value
Home Financials for this Owner
Home Financials are based on the most recent Mortgage that was taken out on this home.
Original Mortgage
$267,633
Outstanding Balance
$223,078
Interest Rate
3.92%
Mortgage Type
VA
Estimated Equity
$223,500
Purchase Details
Closed on
Jun 9, 2017
Sold by
Fravel Trisha and Fravel Trisha L
Bought by
Courlin Properties Llc
Purchase Details
Closed on
Jun 30, 2010
Sold by
M/I Homes Of Central Ohio Llc
Bought by
Fravel Trisha L
Home Financials for this Owner
Home Financials are based on the most recent Mortgage that was taken out on this home.
Original Mortgage
$184,588
Interest Rate
4.75%
Mortgage Type
FHA
Create a Home Valuation Report for This Property
The Home Valuation Report is an in-depth analysis detailing your home's value as well as a comparison with similar homes in the area
Home Values in the Area
Average Home Value in this Area
Purchase History
| Date | Buyer | Sale Price | Title Company |
|---|---|---|---|
| Weber Michael J | $262,000 | None Available | |
| Courlin Properties Llc | $206,500 | None Available | |
| Fravel Trisha L | $187,100 | None Available |
Source: Public Records
Mortgage History
| Date | Status | Borrower | Loan Amount |
|---|---|---|---|
| Open | Weber Michael J | $267,633 | |
| Previous Owner | Fravel Trisha L | $184,588 |
Source: Public Records
Tax History
| Year | Tax Paid | Tax Assessment Tax Assessment Total Assessment is a certain percentage of the fair market value that is determined by local assessors to be the total taxable value of land and additions on the property. | Land | Improvement |
|---|---|---|---|---|
| 2025 | $14,248 | $135,300 | $33,120 | $102,180 |
| 2024 | $14,248 | $115,740 | $14,710 | $101,030 |
| 2023 | $5,457 | $115,740 | $14,710 | $101,030 |
| 2022 | $5,474 | $115,740 | $14,710 | $101,030 |
| 2021 | $4,702 | $84,660 | $14,010 | $70,650 |
| 2020 | $4,754 | $84,660 | $14,010 | $70,650 |
| 2019 | $4,783 | $84,660 | $14,010 | $70,650 |
| 2018 | $4,836 | $74,440 | $14,010 | $60,430 |
| 2017 | $4,827 | $72,970 | $12,540 | $60,430 |
| 2016 | $4,713 | $72,970 | $12,540 | $60,430 |
| 2015 | $4,501 | $65,900 | $10,450 | $55,450 |
| 2014 | $4,447 | $65,900 | $10,450 | $55,450 |
| 2013 | $4,447 | $65,900 | $10,450 | $55,450 |
Source: Public Records
Map
Nearby Homes
- 143 Cinnamon Teal St
- 566 Preston Trails Dr
- 217 Warbler Ct
- 213 Painter St
- 216 Painter St
- 108 Gold Finch St
- 116 Gold Finch St
- 139 Gold Finch St
- 223 Antrim St
- 657 Raab St
- 240 Fox Glen Dr E
- 10164 Busey Rd NW
- 594 Raab St
- 431 Vanderbuilt St
- 5436 Arrow Ct
- 447 Wooster St
- 292 Autumn Ridge Cir
- 211 Sterndale Dr
- 7516 Hemrich Dr
- 7502 Canal Highlands Blvd
- 122 Longleaf St
- 126 Longleaf St
- 118 Longleaf St
- 89 Catalpa Ct
- 114 Longleaf St
- 114 Longleaf St Unit 231
- 93 Catalpa Ct
- 127 Mulberry St
- 127 Longleaf St
- 131 Longleaf St
- 123 Longleaf St
- 123 Mulberry St
- 85 Catalpa Ct
- 110 Longleaf St
- 119 Mulberry St
- 135 Longleaf St
- 119 Longleaf St
- 115 Mulberry St
- 115 Longleaf St
- 115 Longleaf St Unit 236
Your Personal Tour Guide
Ask me questions while you tour the home.