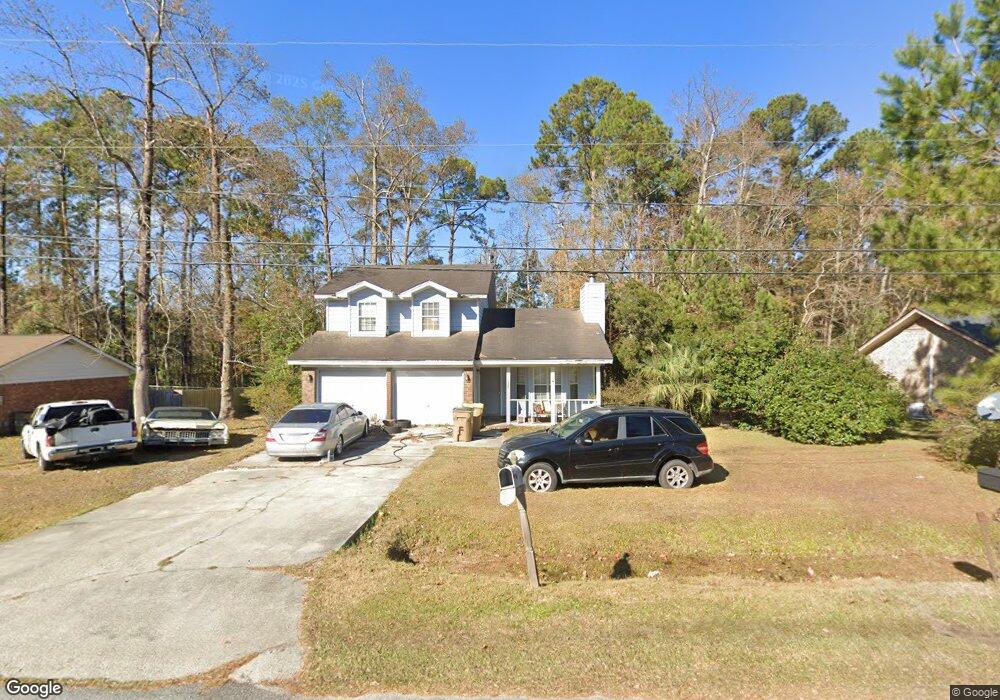
122 Mulberry Way Rincon, GA 31326
Estimated Value: $224,000 - $261,253
3
Beds
3
Baths
907
Sq Ft
$272/Sq Ft
Est. Value
About This Home
This home is located at 122 Mulberry Way, Rincon, GA 31326 and is currently estimated at $247,063, approximately $272 per square foot. 122 Mulberry Way is a home located in Effingham County with nearby schools including Blandford Elementary School, Ebenezer Middle School, and South Effingham High School.
Ownership History
Date
Name
Owned For
Owner Type
Purchase Details
Closed on
Jul 19, 2010
Sold by
Hsbc Mortgage Services Inc
Bought by
Frazier Sylvester W
Current Estimated Value
Home Financials for this Owner
Home Financials are based on the most recent Mortgage that was taken out on this home.
Original Mortgage
$93,495
Outstanding Balance
$62,593
Interest Rate
4.87%
Mortgage Type
FHA
Estimated Equity
$184,470
Purchase Details
Closed on
Jun 4, 2010
Sold by
Hsbc Mortgage Services
Bought by
Frazier Sylvester W
Home Financials for this Owner
Home Financials are based on the most recent Mortgage that was taken out on this home.
Original Mortgage
$93,495
Outstanding Balance
$62,593
Interest Rate
4.87%
Mortgage Type
FHA
Estimated Equity
$184,470
Purchase Details
Closed on
Dec 1, 2009
Bought by
Hsbc Mortgage Services
Create a Home Valuation Report for This Property
The Home Valuation Report is an in-depth analysis detailing your home's value as well as a comparison with similar homes in the area
Home Values in the Area
Average Home Value in this Area
Purchase History
| Date | Buyer | Sale Price | Title Company |
|---|---|---|---|
| Frazier Sylvester W | $94,755 | -- | |
| Frazier Sylvester W | $94,800 | -- | |
| Hsbc Mortgage Services | $97,300 | -- | |
| Hsbc Mortgage Services Inc | $97,261 | -- |
Source: Public Records
Mortgage History
| Date | Status | Borrower | Loan Amount |
|---|---|---|---|
| Open | Frazier Sylvester W | $93,495 |
Source: Public Records
Tax History Compared to Growth
Tax History
| Year | Tax Paid | Tax Assessment Tax Assessment Total Assessment is a certain percentage of the fair market value that is determined by local assessors to be the total taxable value of land and additions on the property. | Land | Improvement |
|---|---|---|---|---|
| 2024 | $1,695 | $80,988 | $22,800 | $58,188 |
| 2023 | $980 | $74,396 | $18,800 | $55,596 |
| 2022 | $1,458 | $57,651 | $14,000 | $43,651 |
| 2021 | $1,421 | $57,115 | $14,000 | $43,115 |
| 2020 | $1,397 | $54,220 | $12,000 | $42,220 |
| 2019 | $1,345 | $48,730 | $10,000 | $38,730 |
| 2018 | $1,375 | $49,679 | $10,000 | $39,679 |
| 2017 | $1,347 | $47,532 | $9,560 | $37,972 |
| 2016 | $1,293 | $46,783 | $8,000 | $38,783 |
| 2015 | $1,290 | $39,390 | $5,600 | $33,790 |
| 2014 | $1,300 | $39,007 | $5,600 | $33,407 |
| 2013 | -- | $36,407 | $3,000 | $33,407 |
Source: Public Records
Map
Nearby Homes
- 121 Westwood Dr
- 210 Mulberry Way
- 205 Whitehall Ave
- 103 Westwood Dr
- 101 Greene Dr
- 210 Vale Royal Dr
- 223 Melrose Place
- 127 John Glenn Dr
- 100 Usher Place
- 214 Lord Effingham Dr
- 107 Charlton Rd
- 5030 Winfield Dr
- 5475 Mccall Rd
- 13 Towne Park Dr
- 15 Towne Park Dr
- 17 Towne Park Dr
- 11 Towne Park Ct
- 21 Towne Park Ct
- 1014 Towne Park Dr
- 4002 Winfield Dr
- 120 Mulberry Way
- 124 Mulberry Way
- 119 Mulberry Way
- 126 Mulberry Way
- 121 Mulberry Way
- 118 Mulberry Way
- 123 Mulberry Way
- 116 Mulberry Way
- 115 Mulberry Way
- 125 Mulberry Way
- 128 Mulberry Way
- 114 Mulberry Way
- 118 Whitehall Ave
- 120 Whitehall Ave
- 0 Mulberry Way Unit 7410704
- 0 Mulberry Way
- 116 Whitehall Ave
- 122 Whitehall Ave
- 113 Mulberry Way
- 114 Whitehall Ave