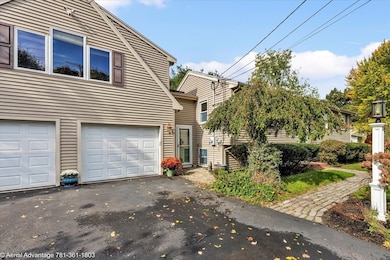
122 N Elm St West Bridgewater, MA 02379
Estimated payment $5,159/month
Highlights
- Medical Services
- Open Floorplan
- Deck
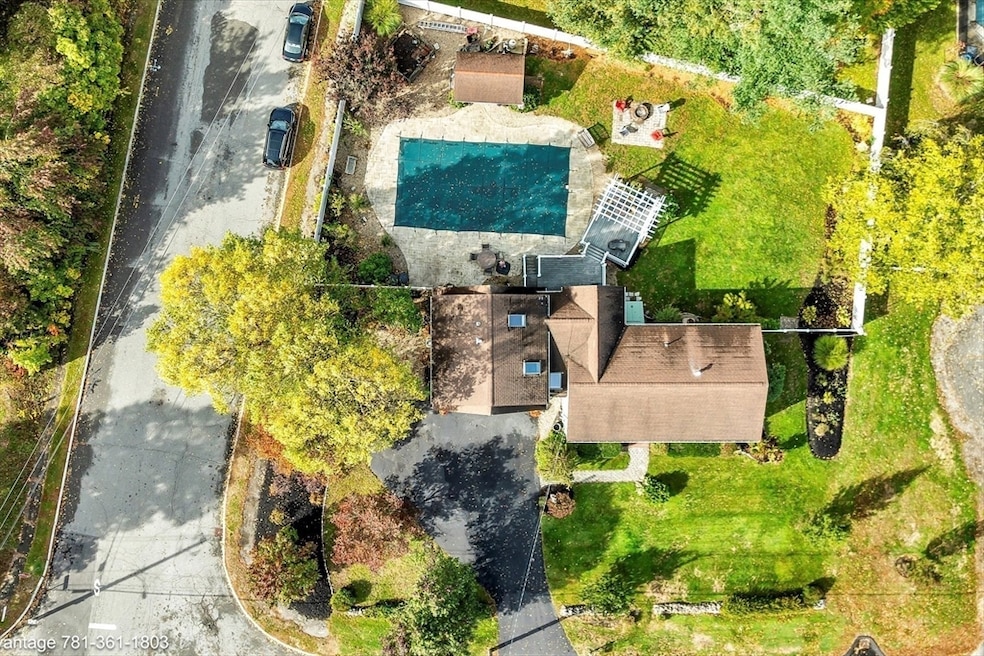
- In Ground Pool
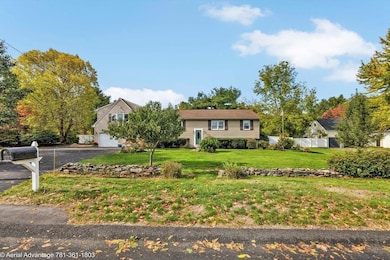
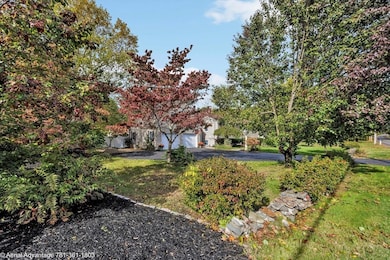
- Landscaped Professionally
- Property is near public transit
About This Home
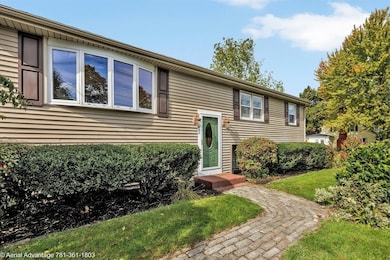
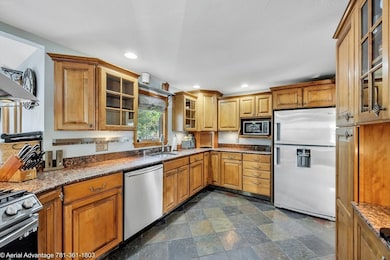
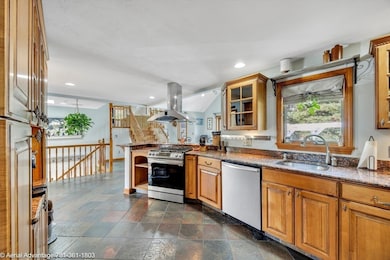
Exceptional remolded front to back split with addition, 2 car oversized heated garage with built-ins and also many upgrades. Lovely mature professional landscaping, Resort style backyard with raised decks, large patio stamped concrete with large relaxing pool. In-ground pool 20 x 40 with new liner, pool shed, fire pit, open lawn space for games. New fenced in yard with cobble stone walkways from historical Boston waterfront. Beautiful remodeled kitchen with granite countertops, stainless steel appliances, designer style maple wood cabinets and slate stone flooring. Huge light filled primary bedroom with full bath and walk-in closet. Living room and dining room with slider to outdoor decks with a pergola. Natural light filled freshly painted Family room with newly refinished hardwood floors. Also a nearby full bathroom, and bedrooms, as well as an office. Lower level has a huge game room with a cedar closet, large den with built in shelves, & work shop room, with a nearby washroom.
Home Details
Home Type
- Single Family
Est. Annual Taxes
- $7,091
Year Built
- Built in 1966 | Remodeled
Lot Details
- 0.43 Acre Lot
- Fenced Yard
- Landscaped Professionally
- Corner Lot
- Property is zoned R1
Parking
- 2 Car Attached Garage
- Parking Storage or Cabinetry
- Heated Garage
- Workshop in Garage
- Garage Door Opener
- Open Parking
- Off-Street Parking
Home Design
- Raised Ranch Architecture
- Frame Construction
- Blown Fiberglass Insulation
- Shingle Roof
- Concrete Perimeter Foundation
Interior Spaces
- Open Floorplan
- Chair Railings
- Cathedral Ceiling
- Ceiling Fan
- Skylights
- Recessed Lighting
- Decorative Lighting
- Light Fixtures
- Insulated Windows
- Bay Window
- Picture Window
- Window Screens
- Sliding Doors
- Insulated Doors
- Home Office
- Game Room
- Attic Access Panel
Kitchen
- Stove
- Range with Range Hood
- Freezer
- Dishwasher
- Stainless Steel Appliances
- Kitchen Island
- Solid Surface Countertops
Flooring
- Engineered Wood
- Wall to Wall Carpet
- Stone
- Ceramic Tile
- Vinyl
Bedrooms and Bathrooms
- 3 Bedrooms
- Primary bedroom located on second floor
- Cedar Closet
- Walk-In Closet
- 3 Full Bathrooms
Laundry
- Laundry in Bathroom
- Dryer
- Washer
Finished Basement
- Basement Fills Entire Space Under The House
- Exterior Basement Entry
- Block Basement Construction
- Laundry in Basement
Outdoor Features
- In Ground Pool
- Bulkhead
- Balcony
- Deck
- Patio
- Separate Outdoor Workshop
- Outdoor Storage
- Rain Gutters
Location
- Property is near public transit
- Property is near schools
Schools
- Rose L Macdonald Elementary School
- West Bridgewater Middle-Senior High School
Utilities
- Two cooling system units
- Forced Air Heating and Cooling System
- 2 Cooling Zones
- 2 Heating Zones
- Heating System Uses Natural Gas
- Generator Hookup
- 220 Volts
- Power Generator
- Gas Water Heater
- Private Sewer
- High Speed Internet
- Cable TV Available
Listing and Financial Details
- Tax Lot 009
- Assessor Parcel Number 1196776
Community Details
Recreation
- Community Pool
- Park
- Jogging Path
Additional Features
- No Home Owners Association
- Medical Services
Map
Home Values in the Area
Average Home Value in this Area
Tax History
| Year | Tax Paid | Tax Assessment Tax Assessment Total Assessment is a certain percentage of the fair market value that is determined by local assessors to be the total taxable value of land and additions on the property. | Land | Improvement |
|---|---|---|---|---|
| 2025 | $7,091 | $518,700 | $206,500 | $312,200 |
| 2024 | $6,729 | $474,900 | $187,200 | $287,700 |
| 2023 | $6,231 | $405,400 | $162,100 | $243,300 |
| 2022 | $6,144 | $378,800 | $152,400 | $226,400 |
| 2021 | $6,012 | $359,800 | $152,400 | $207,400 |
| 2020 | $5,828 | $356,000 | $152,400 | $203,600 |
| 2019 | $5,602 | $338,900 | $152,400 | $186,500 |
| 2018 | $8,912 | $316,200 | $144,700 | $171,500 |
| 2017 | $5,303 | $299,100 | $131,200 | $167,900 |
| 2016 | $5,218 | $289,900 | $122,000 | $167,900 |
| 2015 | $5,062 | $284,200 | $122,000 | $162,200 |
| 2014 | $4,624 | $280,400 | $122,000 | $158,400 |
Property History
| Date | Event | Price | List to Sale | Price per Sq Ft |
|---|---|---|---|---|
| 10/24/2025 10/24/25 | For Sale | $865,000 | -- | $300 / Sq Ft |
Purchase History
| Date | Type | Sale Price | Title Company |
|---|---|---|---|
| Quit Claim Deed | -- | None Available | |
| Quit Claim Deed | -- | None Available | |
| Deed | $144,000 | -- | |
| Deed | $144,000 | -- |
Mortgage History
| Date | Status | Loan Amount | Loan Type |
|---|---|---|---|
| Previous Owner | $257,500 | No Value Available | |
| Previous Owner | $288,600 | No Value Available | |
| Previous Owner | $290,000 | No Value Available |
Source: MLS Property Information Network (MLS PIN)
MLS Number: 73446784
APN: WBRI-000038-000000-000009
Disclaimer: Certain information contained herein is derived from information provided by parties other than Homes.com. All information provided is deemed reliable, but is not guaranteed to be accurate and should be independently verified.
![]() The property listing data and information, or the Images, set forth herein were provided to MLS Property Information Network, Inc. from third party sources, including sellers, lessors and public records, and were compiled by MLS Property Information Network, Inc. The property listing data and information, and the Images, are for the personal, non-commercial use of consumers having a good faith interest in purchasing or leasing listed properties of the type displayed to them and may not be used for any purpose other than to identify prospective properties which such consumers may have a good faith interest in purchasing or leasing. MLS Property Information Network, Inc. and its subscribers disclaim any and all representations and warranties as to the accuracy of the property listing data and information, or as to the accuracy of any of the Images, set forth herein.
The property listing data and information, or the Images, set forth herein were provided to MLS Property Information Network, Inc. from third party sources, including sellers, lessors and public records, and were compiled by MLS Property Information Network, Inc. The property listing data and information, and the Images, are for the personal, non-commercial use of consumers having a good faith interest in purchasing or leasing listed properties of the type displayed to them and may not be used for any purpose other than to identify prospective properties which such consumers may have a good faith interest in purchasing or leasing. MLS Property Information Network, Inc. and its subscribers disclaim any and all representations and warranties as to the accuracy of the property listing data and information, or as to the accuracy of any of the Images, set forth herein.
- 66 Prospect St
- 10 Charles St
- 29 Ellis Ave
- 260 Crescent St
- 281 Spring St
- 282 Crescent St
- 288 Crescent St
- 279 Crescent St
- Lot 1 Jeffrey Ln
- 6 Maddison
- 92 Bryant St
- 227 S Elm Lot2
- 323 S Elm St
- 42 Matfield St
- 21 Roosevelt Ave
- 192 S Main St
- 58 Metacomet Rd Unit 17
- 37 Metacomet Rd Unit 37
- 44 Metacomet Rd Unit 44
- 20 Metacomet Rd Unit 20
- 368 N Elm St Unit 2
- 28-30 Maolis Ave Unit 2
- 445 W Center St Unit b2
- 477 W Center St
- 464 Main St
- 464 Main St
- 30 Holmes St Unit 1st floor
- 41 Carleton Ave Unit 1
- 41 Carleton Ave Unit 2
- 20 Watson St Unit 2
- 50 Comfort St
- 180 Main St Unit 1305
- 180 Main St
- 165 Carl Ave
- 13 Perkins Ave Unit 1
- 180 Main St Unit 4
- 60 Tremont St Unit 2
- 188 Perkins Ave Unit 188 Perkins Ave
- 58 Denton St
- 25 E Nilsson St
