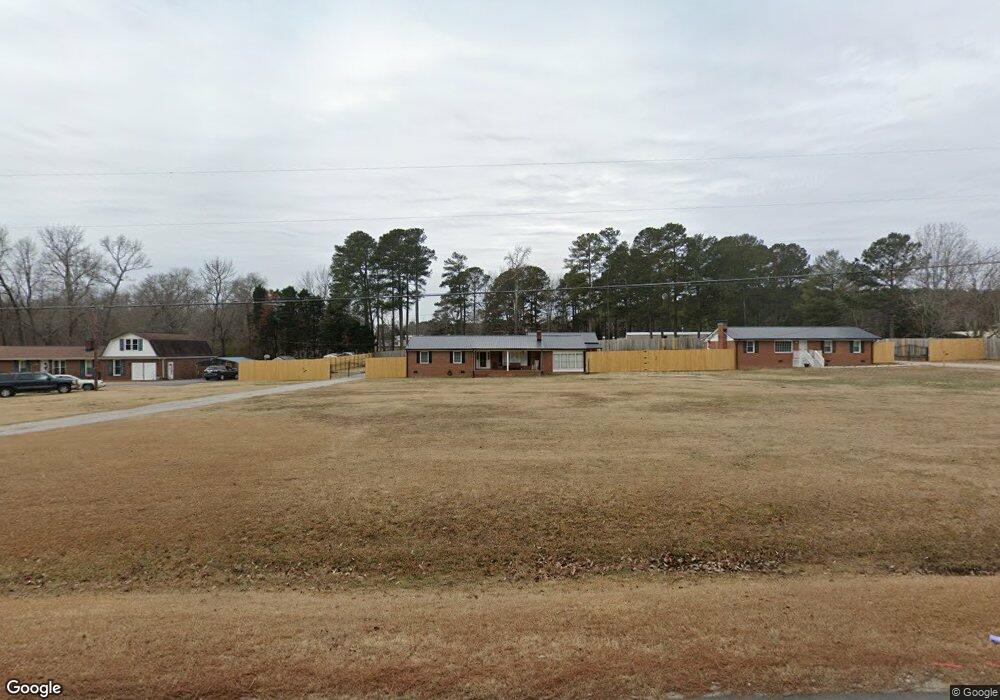
122 Nc 39 Loop Rd Henderson, NC 27537
Estimated Value: $169,000 - $236,000
3
Beds
2
Baths
1,632
Sq Ft
$130/Sq Ft
Est. Value
About This Home
This home is located at 122 Nc 39 Loop Rd, Henderson, NC 27537 and is currently estimated at $211,802, approximately $129 per square foot. 122 Nc 39 Loop Rd is a home located in Vance County with nearby schools including Clarke Elementary School, Henderson Middle School, and Vance County High School.
Ownership History
Date
Name
Owned For
Owner Type
Purchase Details
Closed on
Oct 6, 2023
Sold by
Boyd Lisa C and Boyd James M
Bought by
Buchanan Christopher R and Buchanan Emily C
Current Estimated Value
Home Financials for this Owner
Home Financials are based on the most recent Mortgage that was taken out on this home.
Original Mortgage
$175,000
Outstanding Balance
$160,973
Interest Rate
6.55%
Mortgage Type
New Conventional
Estimated Equity
$50,829
Purchase Details
Closed on
Mar 3, 2022
Sold by
Renn Coghill Sarah and Renn Russell
Bought by
Boyd Lisa C
Home Financials for this Owner
Home Financials are based on the most recent Mortgage that was taken out on this home.
Original Mortgage
$175,000
Interest Rate
3.92%
Mortgage Type
New Conventional
Purchase Details
Closed on
Dec 15, 2021
Sold by
Boyd James M and Boyd Lisa C
Bought by
Brust Wilhelm and Williams Brust Helen
Purchase Details
Closed on
Oct 1, 2007
Sold by
Coghill Emily M
Bought by
Evans Lisa C and Roberson Sandra Kaye Coghill
Create a Home Valuation Report for This Property
The Home Valuation Report is an in-depth analysis detailing your home's value as well as a comparison with similar homes in the area
Home Values in the Area
Average Home Value in this Area
Purchase History
| Date | Buyer | Sale Price | Title Company |
|---|---|---|---|
| Buchanan Christopher R | $175,000 | None Listed On Document | |
| Boyd Lisa C | -- | Renn Lori A | |
| Boyd Lisa C | -- | None Listed On Document | |
| Brust Wilhelm | -- | None Available | |
| Coghill Sarah Renn | -- | None Available | |
| Evans Lisa C | -- | -- |
Source: Public Records
Mortgage History
| Date | Status | Borrower | Loan Amount |
|---|---|---|---|
| Open | Buchanan Christopher R | $175,000 | |
| Previous Owner | Boyd Lisa C | $175,000 |
Source: Public Records
Tax History Compared to Growth
Tax History
| Year | Tax Paid | Tax Assessment Tax Assessment Total Assessment is a certain percentage of the fair market value that is determined by local assessors to be the total taxable value of land and additions on the property. | Land | Improvement |
|---|---|---|---|---|
| 2025 | $1,496 | $168,107 | $22,381 | $145,726 |
| 2024 | $1,441 | $168,107 | $22,381 | $145,726 |
| 2023 | $893 | $79,005 | $9,476 | $69,529 |
| 2022 | $893 | $79,005 | $9,476 | $69,529 |
| 2021 | $893 | $79,005 | $9,476 | $69,529 |
| 2020 | $890 | $79,005 | $9,476 | $69,529 |
| 2019 | $885 | $79,005 | $9,476 | $69,529 |
| 2018 | $738 | $79,005 | $9,476 | $69,529 |
| 2017 | $843 | $79,005 | $9,476 | $69,529 |
| 2016 | $843 | $79,005 | $9,476 | $69,529 |
| 2015 | $663 | $79,550 | $10,553 | $68,997 |
| 2014 | $767 | $79,556 | $10,553 | $69,003 |
Source: Public Records
Map
Nearby Homes
- 85 Southside Estates Ct
- 00 Garrett Rd
- 00 Bearpond Rd
- 3124 Raleigh Rd
- 156 Daffodil Dr
- 230 Big Buck Rd
- 731 Fawn Dr
- 0 Victory St Unit 10119455
- 1175 Faulkner Town Rd
- 870 Abbott Rd
- 1816 S Clearview Dr
- 1851 S Clearview Dr
- 0 Wilkins Ln
- 155 1st St
- Lot A Vicksboro Rd
- 105 S Elizabeth St
- 129 S Bullock St
- 735 Alexander Ave
- 714 Harriett St
- 1000 Club Pond Rd
- 98 Nc 39 Loop Rd
- 152 Nc 39 Loop Rd
- 12 Fulcher Farm Ln
- 26 Nc 39 Loop Rd
- 1010 Vanco Mill Rd
- 0 N C 39 Loop Rd
- 992 Vanco Mill Rd
- 0 Nc 39 Loop Rd Unit 1874797
- 0 Nc 39 Loop Rd Unit 1763102
- 0 Nc 39 Loop Rd Unit TR1763102
- 0 Nc 39 Loop Rd Unit TR1874797
- 3866 Stainback Land S
- 276 Nc 39 Loop Rd
- 940 Vanco Mill Rd
- 985 Vanco Mill Rd
- 3888 Nc 39 Hwy S
- 3901 Nc 39 Hwy S
- 3929 N Carolina 39
- 3929 Nc 39 Hwy S
- 315 Nc 39 Loop Rd