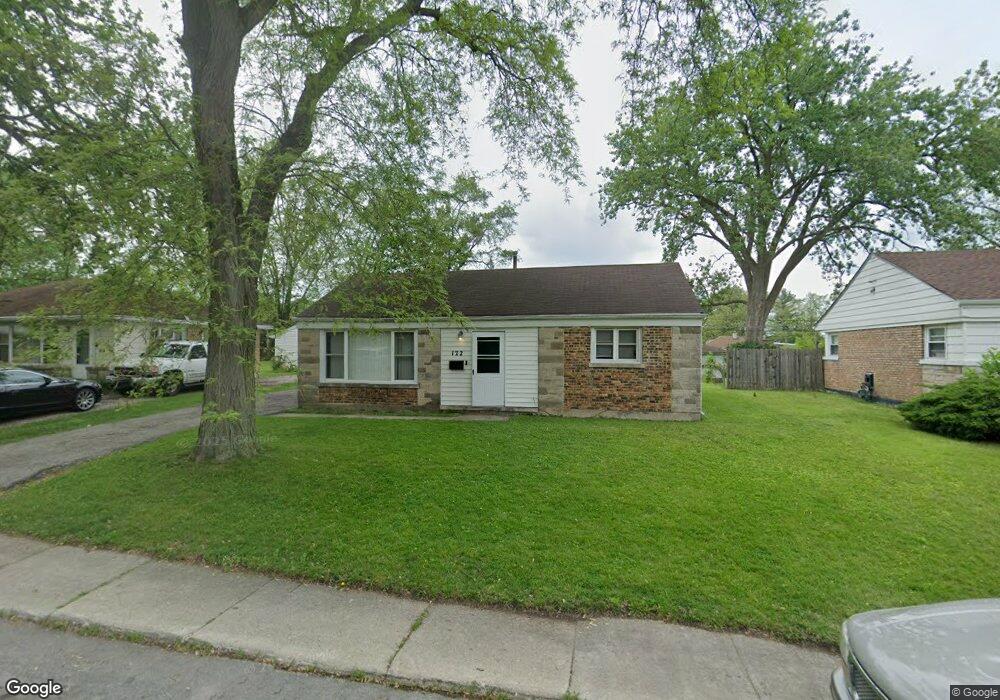
122 Peach St Park Forest, IL 60466
Estimated Value: $125,000 - $165,000
2
Beds
1
Bath
949
Sq Ft
$146/Sq Ft
Est. Value
About This Home
This home is located at 122 Peach St, Park Forest, IL 60466 and is currently estimated at $138,461, approximately $145 per square foot. 122 Peach St is a home located in Cook County with nearby schools including 21st Century Primary Center, Blackhawk Intermediate Center, and Michelle Obama School of Technology.
Ownership History
Date
Name
Owned For
Owner Type
Purchase Details
Closed on
Aug 9, 2011
Sold by
Kilbourn Gary R and Kilburn Gary R
Bought by
Castle Ridge Builders Llc
Current Estimated Value
Purchase Details
Closed on
Jun 29, 2004
Sold by
Jordan Gary R and Jordan Miriah D
Bought by
Kilbourn Gary R
Home Financials for this Owner
Home Financials are based on the most recent Mortgage that was taken out on this home.
Original Mortgage
$86,148
Interest Rate
6.37%
Mortgage Type
FHA
Purchase Details
Closed on
Sep 20, 2001
Sold by
Frye Tony L
Bought by
Jordan Garyr
Home Financials for this Owner
Home Financials are based on the most recent Mortgage that was taken out on this home.
Original Mortgage
$76,302
Interest Rate
6.88%
Mortgage Type
FHA
Purchase Details
Closed on
Jun 1, 2001
Sold by
Novak Russell R and Novak Ruth
Bought by
Frye Tony L
Home Financials for this Owner
Home Financials are based on the most recent Mortgage that was taken out on this home.
Original Mortgage
$53,910
Interest Rate
7.23%
Create a Home Valuation Report for This Property
The Home Valuation Report is an in-depth analysis detailing your home's value as well as a comparison with similar homes in the area
Home Values in the Area
Average Home Value in this Area
Purchase History
| Date | Buyer | Sale Price | Title Company |
|---|---|---|---|
| Castle Ridge Builders Llc | $28,000 | Pntn | |
| Kilbourn Gary R | $87,500 | Millennium Title Group | |
| Jordan Garyr | $77,500 | Professional National Title | |
| Frye Tony L | $60,000 | -- |
Source: Public Records
Mortgage History
| Date | Status | Borrower | Loan Amount |
|---|---|---|---|
| Previous Owner | Kilbourn Gary R | $86,148 | |
| Previous Owner | Jordan Garyr | $76,302 | |
| Previous Owner | Frye Tony L | $53,910 |
Source: Public Records
Tax History Compared to Growth
Tax History
| Year | Tax Paid | Tax Assessment Tax Assessment Total Assessment is a certain percentage of the fair market value that is determined by local assessors to be the total taxable value of land and additions on the property. | Land | Improvement |
|---|---|---|---|---|
| 2024 | $7,555 | $9,961 | $2,625 | $7,336 |
| 2023 | $4,732 | $10,321 | $2,625 | $7,696 |
| 2022 | $4,732 | $3,520 | $2,438 | $1,082 |
| 2021 | $4,643 | $3,519 | $2,437 | $1,082 |
| 2020 | $4,233 | $3,519 | $2,437 | $1,082 |
| 2019 | $5,258 | $4,831 | $2,250 | $2,581 |
| 2018 | $5,068 | $4,831 | $2,250 | $2,581 |
| 2017 | $6,159 | $5,908 | $2,250 | $3,658 |
| 2016 | $5,050 | $5,080 | $2,062 | $3,018 |
| 2015 | $4,935 | $5,080 | $2,062 | $3,018 |
| 2014 | $4,791 | $5,080 | $2,062 | $3,018 |
| 2013 | $5,222 | $6,181 | $2,062 | $4,119 |
Source: Public Records
Map
Nearby Homes
- 123 Peach St
- 243 Indianwood Blvd
- 131 Sauk Trail
- 226 S Orchard Dr
- 142 Marquette St
- 71 Cherry St
- 55 Apple Ln
- 214 Marquette St
- 322 Nokomis St
- 218 Marquette St
- 18 E Rocket Cir
- 74 Marquette St
- 329 Indianwood Blvd
- 35 Mcgarity Rd Unit 772
- 326 Nassau St
- 300 Meota St
- 332 Nokomis St
- 6 Marquette Place
- 42 Sauk Trail
- 62 Marquette St
- 124 Peach St
- 120 Peach St
- 118 Peach St
- 126 Peach St
- 225 Indianwood Blvd
- 227 Indianwood Blvd
- 223 Indianwood Blvd
- 229 Indianwood Blvd
- 121 Peach St
- 221 Indianwood Blvd
- 116 Peach St
- 128 Peach St
- 119 Peach St
- 231 Indianwood Blvd
- 117 Peach St
- 125 Peach St
- 219 Indianwood Blvd
- 114 Peach St
- 127 Peach St
- 130 Peach St