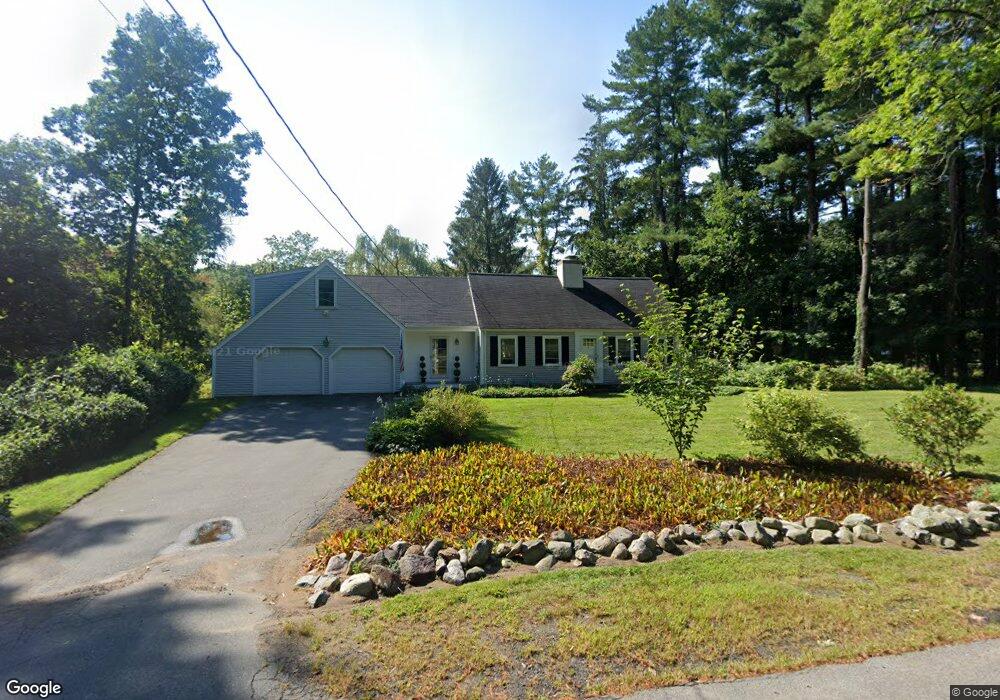
122 Perkins Row Topsfield, MA 01983
Estimated Value: $785,534 - $889,000
2
Beds
2
Baths
1,398
Sq Ft
$597/Sq Ft
Est. Value
About This Home
This home is located at 122 Perkins Row, Topsfield, MA 01983 and is currently estimated at $834,384, approximately $596 per square foot. 122 Perkins Row is a home located in Essex County with nearby schools including Steward Elementary School, Proctor Elementary School, and Masconomet Regional Middle School.
Ownership History
Date
Name
Owned For
Owner Type
Purchase Details
Closed on
Apr 3, 2020
Sold by
Scott Adam H and Scott Brenda F
Bought by
Scott Ft
Current Estimated Value
Home Financials for this Owner
Home Financials are based on the most recent Mortgage that was taken out on this home.
Original Mortgage
$364,000
Outstanding Balance
$322,460
Interest Rate
3.4%
Mortgage Type
New Conventional
Estimated Equity
$511,924
Purchase Details
Closed on
Mar 27, 2020
Sold by
Scott Ft
Bought by
Scott Adam H and Scott Brenda F
Home Financials for this Owner
Home Financials are based on the most recent Mortgage that was taken out on this home.
Original Mortgage
$364,000
Outstanding Balance
$322,460
Interest Rate
3.4%
Mortgage Type
New Conventional
Estimated Equity
$511,924
Purchase Details
Closed on
Jul 13, 2018
Sold by
Scott Adam H and Scott Brenda F
Bought by
Scott Ft
Home Financials for this Owner
Home Financials are based on the most recent Mortgage that was taken out on this home.
Original Mortgage
$366,400
Interest Rate
4.5%
Mortgage Type
New Conventional
Purchase Details
Closed on
Jun 26, 2018
Sold by
Scott Ft
Bought by
Scott Adam H and Scott Brenda F
Home Financials for this Owner
Home Financials are based on the most recent Mortgage that was taken out on this home.
Original Mortgage
$366,400
Interest Rate
4.5%
Mortgage Type
New Conventional
Purchase Details
Closed on
Aug 11, 2015
Sold by
Scott Adam H and Scott Brenda F
Bought by
Scott Ft
Purchase Details
Closed on
Jul 1, 2002
Sold by
Laidley Shawn M
Bought by
Scott Adam H and Scott Brenda F
Purchase Details
Closed on
Jun 30, 2000
Sold by
Farnham Edward H and Farnham Kathryn H
Bought by
Laidley Shawn M and Laidley Christine
Purchase Details
Closed on
Nov 13, 1995
Sold by
Regan John J and Regan John
Bought by
Farnham Edward H and Farnham Kathryn H
Create a Home Valuation Report for This Property
The Home Valuation Report is an in-depth analysis detailing your home's value as well as a comparison with similar homes in the area
Home Values in the Area
Average Home Value in this Area
Purchase History
| Date | Buyer | Sale Price | Title Company |
|---|---|---|---|
| Scott Ft | -- | None Available | |
| Scott Adam H | -- | None Available | |
| Scott Ft | -- | -- | |
| Scott Adam H | -- | -- | |
| Scott Ft | -- | -- | |
| Scott Adam H | $400,000 | -- | |
| Laidley Shawn M | $310,000 | -- | |
| Farnham Edward H | $230,000 | -- |
Source: Public Records
Mortgage History
| Date | Status | Borrower | Loan Amount |
|---|---|---|---|
| Open | Scott Adam H | $364,000 | |
| Previous Owner | Scott Adam H | $366,400 | |
| Previous Owner | Farnham Edward H | $75,000 | |
| Previous Owner | Farnham Edward H | $320,000 |
Source: Public Records
Tax History Compared to Growth
Tax History
| Year | Tax Paid | Tax Assessment Tax Assessment Total Assessment is a certain percentage of the fair market value that is determined by local assessors to be the total taxable value of land and additions on the property. | Land | Improvement |
|---|---|---|---|---|
| 2025 | $10,827 | $722,300 | $381,200 | $341,100 |
| 2024 | $10,221 | $695,800 | $369,500 | $326,300 |
| 2023 | $9,378 | $617,000 | $350,100 | $266,900 |
| 2022 | $9,757 | $586,000 | $350,100 | $235,900 |
| 2021 | $9,555 | $533,200 | $319,000 | $214,200 |
| 2020 | $9,288 | $533,200 | $319,000 | $214,200 |
| 2019 | $8,085 | $475,600 | $319,000 | $156,600 |
| 2018 | $7,963 | $458,700 | $319,000 | $139,700 |
| 2017 | $7,238 | $427,500 | $287,800 | $139,700 |
| 2016 | $6,834 | $413,700 | $272,300 | $141,400 |
Source: Public Records
Map
Nearby Homes
- 117 Perkins Row
- 137 Perkins Row
- 34 Great Hill Dr Unit 34
- 4 Ruby Cir
- 95 Salem Rd
- 10 Walker Rd
- 8 Mansion Dr
- 40 East St
- 37 East St
- 219 Topsfield Rd
- 76 Parsonage Ln
- 115 Pleasant St
- 17 Canter Brook Ln Unit 17
- 232 Lake Dr
- 14 Alderbrook Dr
- 8 Meridian Rd
- 88 Haverhill Rd
- 315 Lake Dr
- 19 Bridle Spur Ln
- 137 Cherry St
- 6 Audubon Dr
- 121 Perkins Row
- 116 Perkins Row
- 126 Perkins Row
- 3 Proctor Dr
- 110 Perkins Row
- 127 Perkins Row
- 108 Perkins Row
- 119 Perkins Row
- 2 Proctor Dr
- 130 Perkins Row
- 6 Proctor Dr
- 104 Perkins Row
- 129 Perkins Row
- 9 Proctor Dr
- 57 Candlewood Dr
- 134 Perkins Row
- 13 Proctor Dr
- 100 Perkins Row
- 135 Perkins Row