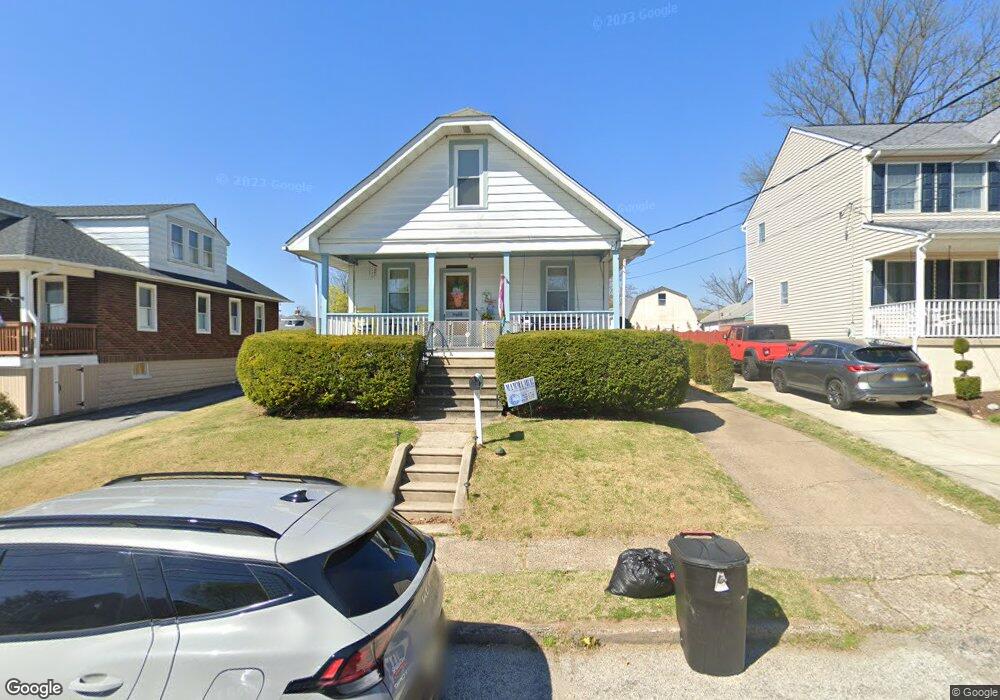
122 S Pine Ave Maple Shade, NJ 08052
Estimated Value: $280,000 - $346,000
Studio
--
Bath
1,290
Sq Ft
$249/Sq Ft
Est. Value
About This Home
This home is located at 122 S Pine Ave, Maple Shade, NJ 08052 and is currently estimated at $321,725, approximately $249 per square foot. 122 S Pine Ave is a home located in Burlington County with nearby schools including Ralph J Steinhauer Elementary School, Maude M. Wilkins Elementary School, and Howard R Yocum School.
Ownership History
Date
Name
Owned For
Owner Type
Purchase Details
Closed on
May 20, 2005
Sold by
Zacierka Lorraine A
Bought by
Stratton Craig W and Stratton Michele L
Current Estimated Value
Home Financials for this Owner
Home Financials are based on the most recent Mortgage that was taken out on this home.
Original Mortgage
$207,100
Outstanding Balance
$112,727
Interest Rate
6.53%
Mortgage Type
Fannie Mae Freddie Mac
Estimated Equity
$208,998
Purchase Details
Closed on
Jun 20, 2003
Sold by
Zacierka Lorraine A
Bought by
Zacierka Lorraine A
Home Financials for this Owner
Home Financials are based on the most recent Mortgage that was taken out on this home.
Original Mortgage
$60,062
Interest Rate
5.46%
Mortgage Type
Purchase Money Mortgage
Purchase Details
Closed on
Mar 22, 1996
Sold by
Gasior Walter S and Gasior Ronald J
Bought by
Zacierka Thomas M and Ronan Lorraine A
Purchase Details
Closed on
Mar 21, 1993
Sold by
Gasior Walter V and Gasior Henrietta
Bought by
Gasior Walter S and Gasior Ronald J
Create a Home Valuation Report for This Property
The Home Valuation Report is an in-depth analysis detailing your home's value as well as a comparison with similar homes in the area
Home Values in the Area
Average Home Value in this Area
Purchase History
| Date | Buyer | Sale Price | Title Company |
|---|---|---|---|
| Stratton Craig W | $218,000 | Congress Title Corp | |
| Zacierka Lorraine A | -- | -- | |
| Zacierka Thomas M | $89,500 | Congress Title Division | |
| Gasior Walter S | -- | -- |
Source: Public Records
Mortgage History
| Date | Status | Borrower | Loan Amount |
|---|---|---|---|
| Open | Stratton Craig W | $207,100 | |
| Previous Owner | Zacierka Lorraine A | $60,062 |
Source: Public Records
Tax History
| Year | Tax Paid | Tax Assessment Tax Assessment Total Assessment is a certain percentage of the fair market value that is determined by local assessors to be the total taxable value of land and additions on the property. | Land | Improvement |
|---|---|---|---|---|
| 2025 | $5,531 | $145,700 | $45,200 | $100,500 |
| 2024 | $5,371 | $145,700 | $45,200 | $100,500 |
| 2023 | $5,371 | $145,700 | $45,200 | $100,500 |
| 2022 | $5,287 | $145,700 | $45,200 | $100,500 |
| 2021 | $5,236 | $145,700 | $45,200 | $100,500 |
| 2020 | $5,251 | $145,700 | $45,200 | $100,500 |
| 2019 | $5,059 | $145,700 | $45,200 | $100,500 |
| 2018 | $4,971 | $145,700 | $45,200 | $100,500 |
| 2017 | $4,913 | $145,700 | $45,200 | $100,500 |
| 2016 | $4,840 | $145,700 | $45,200 | $100,500 |
| 2015 | $4,735 | $145,700 | $45,200 | $100,500 |
| 2014 | $4,591 | $145,700 | $45,200 | $100,500 |
Source: Public Records
Map
Nearby Homes
- 44 S Pine Ave
- 115 S Walnut Ave
- 15 S Pine Ave
- 26 Morris Ave
- 206 S Maple Ave
- 42 Spruce Ave
- 61 S Maple Ave
- 452 Elm Ave
- 22 Theodore Ave
- 411 A3 Stiles Ave Unit A-3
- 411 C12 Stiles Ave Unit C-12
- 411 A2 Stiles Ave Unit A-2
- 207 E Park Ave
- 620 N Lincoln Ave
- 47 S Lippincott Ave
- 66 W Center Ave
- 106 Pine St
- 5 Vincent Way
- 27 Domenica Dr
- 21 N Lenola Rd
- 126 S Pine Ave
- 118 S Pine Ave
- 114 S Pine Ave
- 130 S Pine Ave
- 123 S Holly Ave
- 127 S Holly Ave
- 119 S Holly Ave
- 110 S Pine Ave
- 134 S Pine Ave
- 131 S Holly Ave
- 115 S Holly Ave
- 123 S Pine Ave
- 119 S Pine Ave
- 127 S Pine Ave
- 111 S Holly Ave
- 135 S Holly Ave
- 115 S Pine Ave
- 131 S Pine Ave
- 106 S Pine Ave
- 138 S Pine Ave
Your Personal Tour Guide
Ask me questions while you tour the home.