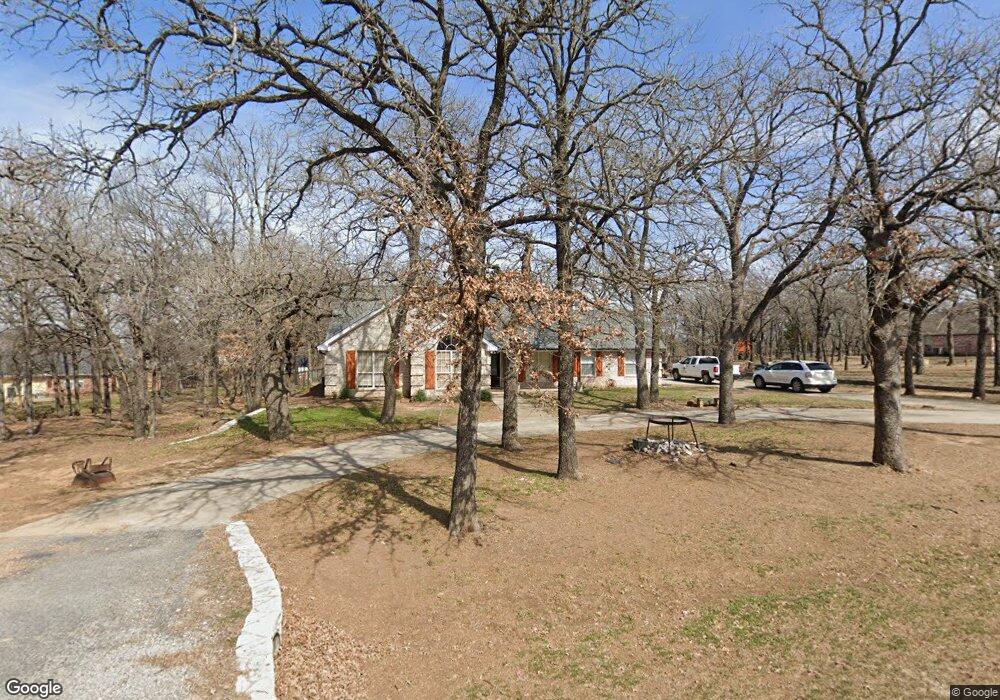
122 Southwood Bend Springtown, TX 76082
Estimated Value: $355,081 - $396,000
3
Beds
2
Baths
1,733
Sq Ft
$219/Sq Ft
Est. Value
About This Home
This home is located at 122 Southwood Bend, Springtown, TX 76082 and is currently estimated at $379,020, approximately $218 per square foot. 122 Southwood Bend is a home located in Parker County with nearby schools including Goshen Creek Elementary School, Springtown Intermediate School, and Springtown Middle School.
Ownership History
Date
Name
Owned For
Owner Type
Purchase Details
Closed on
Dec 21, 2016
Sold by
Wilson Randy C and Wilson Ashley L
Bought by
Pearson Casey
Current Estimated Value
Home Financials for this Owner
Home Financials are based on the most recent Mortgage that was taken out on this home.
Original Mortgage
$227,260
Outstanding Balance
$183,308
Interest Rate
3.57%
Mortgage Type
VA
Estimated Equity
$195,712
Purchase Details
Closed on
Apr 13, 2016
Sold by
Carpenter Beuford Ray and Carpenter Ellen E
Bought by
Pearson Casey
Home Financials for this Owner
Home Financials are based on the most recent Mortgage that was taken out on this home.
Original Mortgage
$190,272
Interest Rate
3.62%
Mortgage Type
FHA
Purchase Details
Closed on
Jan 1, 1997
Bought by
Pearson Casey
Create a Home Valuation Report for This Property
The Home Valuation Report is an in-depth analysis detailing your home's value as well as a comparison with similar homes in the area
Home Values in the Area
Average Home Value in this Area
Purchase History
| Date | Buyer | Sale Price | Title Company |
|---|---|---|---|
| Pearson Casey | -- | None Available | |
| Pearson Casey | -- | -- | |
| Wilson Randy C | -- | Parker County Title Services | |
| Pearson Casey | -- | -- |
Source: Public Records
Mortgage History
| Date | Status | Borrower | Loan Amount |
|---|---|---|---|
| Open | Pearson Casey | $227,260 | |
| Previous Owner | Wilson Randy C | $190,272 |
Source: Public Records
Tax History Compared to Growth
Tax History
| Year | Tax Paid | Tax Assessment Tax Assessment Total Assessment is a certain percentage of the fair market value that is determined by local assessors to be the total taxable value of land and additions on the property. | Land | Improvement |
|---|---|---|---|---|
| 2025 | $2,911 | $279,946 | -- | -- |
| 2024 | $2,911 | $254,496 | -- | -- |
| 2023 | $2,911 | $231,360 | $0 | $0 |
| 2022 | $3,750 | $210,330 | $50,000 | $160,330 |
| 2021 | $4,054 | $210,330 | $50,000 | $160,330 |
| 2020 | $3,673 | $190,390 | $40,000 | $150,390 |
| 2019 | $3,700 | $190,390 | $40,000 | $150,390 |
| 2018 | $3,374 | $162,200 | $30,000 | $132,200 |
| 2017 | $3,535 | $162,200 | $30,000 | $132,200 |
| 2016 | $3,316 | $152,130 | $30,000 | $122,130 |
| 2015 | $2,298 | $152,130 | $30,000 | $122,130 |
| 2014 | $2,451 | $152,470 | $30,000 | $122,470 |
Source: Public Records
Map
Nearby Homes
- 648 Lynch Bend Rd
- 459 Red Bird Dr
- 000 Farm To Market 51
- 1008 E Bradshaw Rd
- 1016 E Bradshaw Rd
- 1004 E Bradshaw Rd
- 460 J e Woody Rd
- 1013 Bradshaw Ct
- 1009 Bradshaw Ct
- 1005 Bradshaw Ct
- 1973 Johnnie Dr
- 309 Jean Ct
- 305 Huggins Dr
- 440 S Main St
- 115 Pleasant Oaks Ln
- 6005 Cottontail Ct
- 1080 Gonzollas Rd
- 1010 Gonzollas Rd
- 9025 Valley Oak Ct
- 9012 Valley Oak Ct
- 150 Southwood Bend
- 110 Southwood Bend
- 135 Southwood Bend
- 125 Southwood Bend
- 115 Southwood Bend
- 115 Southwood Bend
- 143 Southwood Bend
- 162 Southwood Bend
- 151 Southwood Bend
- 178 Southwood Bend
- 163 Southwood Bend
- 179 Southwood Bend
- 8108 N Fm Road 51
- 100 Lynch Bend Rd
- 188 Southwood Bend
- 110 Lynch Bend Rd
- 300 Lynch Bend Rd
- 488 Lynch Bend Rd
- 000 Browder Rd
- 0000 Browder Rd