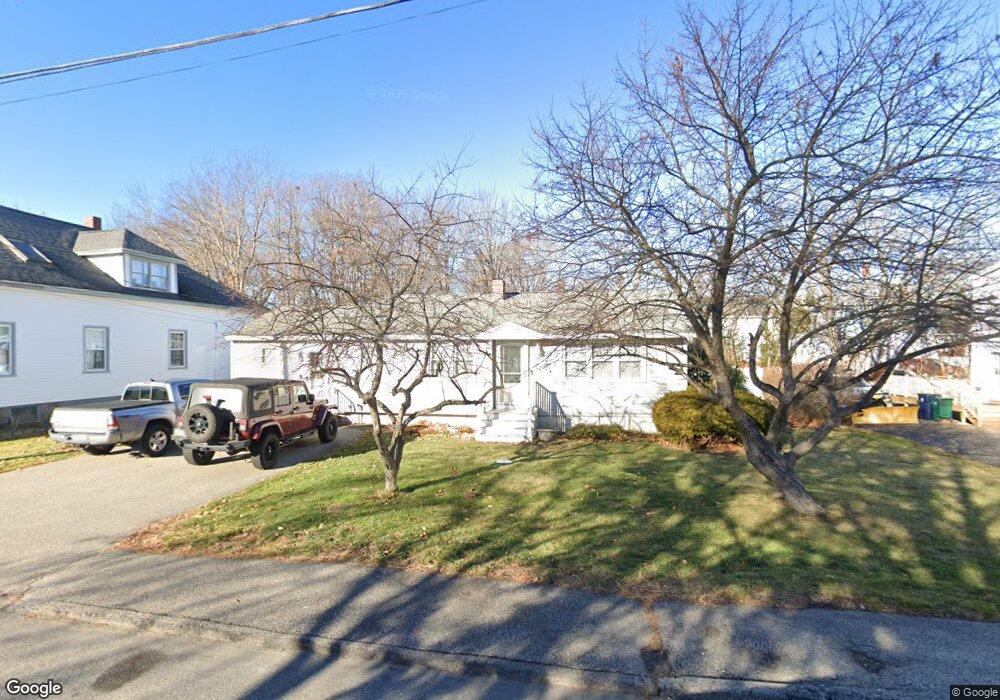
122 Summer St Biddeford, ME 04005
Estimated Value: $390,000 - $413,000
3
Beds
1
Bath
1,269
Sq Ft
$313/Sq Ft
Est. Value
About This Home
This home is located at 122 Summer St, Biddeford, ME 04005 and is currently estimated at $397,511, approximately $313 per square foot. 122 Summer St is a home located in York County with nearby schools including John F Kennedy Memorial School, Biddeford Primary School, and Biddeford Intermediate School.
Ownership History
Date
Name
Owned For
Owner Type
Purchase Details
Closed on
Nov 2, 2007
Sold by
Montembeau Lise C Est
Bought by
Montembeau Daniel E
Current Estimated Value
Home Financials for this Owner
Home Financials are based on the most recent Mortgage that was taken out on this home.
Original Mortgage
$120,000
Interest Rate
6.43%
Mortgage Type
Purchase Money Mortgage
Create a Home Valuation Report for This Property
The Home Valuation Report is an in-depth analysis detailing your home's value as well as a comparison with similar homes in the area
Home Values in the Area
Average Home Value in this Area
Purchase History
| Date | Buyer | Sale Price | Title Company |
|---|---|---|---|
| Montembeau Daniel E | -- | -- |
Source: Public Records
Mortgage History
| Date | Status | Borrower | Loan Amount |
|---|---|---|---|
| Open | Montembeau Daniel E | $120,000 | |
| Closed | Montembeau Daniel E | $120,000 |
Source: Public Records
Tax History
| Year | Tax Paid | Tax Assessment Tax Assessment Total Assessment is a certain percentage of the fair market value that is determined by local assessors to be the total taxable value of land and additions on the property. | Land | Improvement |
|---|---|---|---|---|
| 2025 | $4,525 | $302,900 | $143,200 | $159,700 |
| 2024 | $4,263 | $299,800 | $143,200 | $156,600 |
| 2023 | $3,899 | $297,200 | $140,600 | $156,600 |
| 2022 | $3,594 | $219,000 | $79,700 | $139,300 |
| 2021 | $3,394 | $186,200 | $67,500 | $118,700 |
| 2020 | $3,417 | $170,400 | $61,300 | $109,100 |
| 2019 | $3,405 | $170,400 | $61,300 | $109,100 |
| 2018 | $3,357 | $170,400 | $61,300 | $109,100 |
| 2017 | $3,129 | $155,900 | $61,300 | $94,600 |
| 2016 | $3,096 | $155,900 | $61,300 | $94,600 |
| 2015 | $3,035 | $155,900 | $61,300 | $94,600 |
| 2014 | $2,961 | $155,900 | $61,300 | $94,600 |
| 2013 | -- | $164,000 | $58,800 | $105,200 |
Source: Public Records
Map
Nearby Homes
- 155 Hill St
- 17 Granite St
- 109 Alfred St
- 12 Sheltra Ave
- 5 Oak Place
- 36-38 Pool St
- 7 Willett St
- 66 Graham St
- 11 King St
- 84 Pike St
- 16 Hill St
- 4 Kossuth St
- 11 Chadwick Place
- 2 Main St Unit 15-311
- 2 Main St Unit 17-407
- 2 Main St Unit 15-502
- 2 Main St Unit 18-420
- 2 Main St Unit 17-416
- 2 Main St Unit 18-421
- 2 Main St Unit 15-509
Your Personal Tour Guide
Ask me questions while you tour the home.