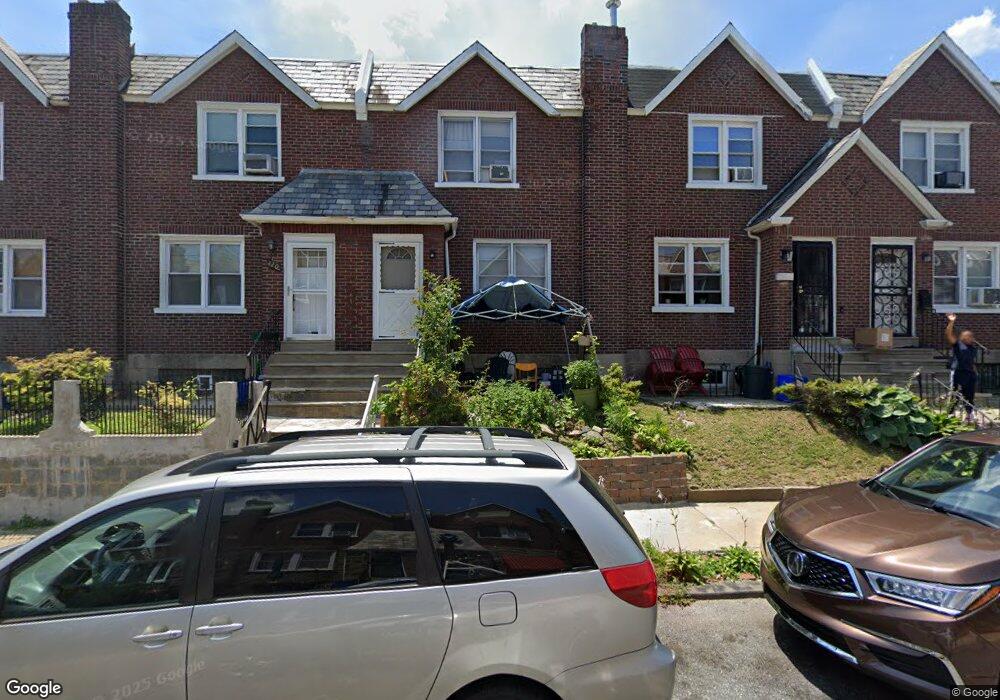
122 Widener St Philadelphia, PA 19120
Olney NeighborhoodEstimated Value: $184,717 - $217,000
3
Beds
2
Baths
1,188
Sq Ft
$166/Sq Ft
Est. Value
About This Home
This home is located at 122 Widener St, Philadelphia, PA 19120 and is currently estimated at $196,679, approximately $165 per square foot. 122 Widener St is a home located in Philadelphia County with nearby schools including James R. Lowell Elementary School, Grover Washington Middle School, and Samuel Fels High School.
Ownership History
Date
Name
Owned For
Owner Type
Purchase Details
Closed on
Jun 27, 2025
Sold by
Findlater Iris
Bought by
Findlater Iris and Brown Sandria White
Current Estimated Value
Purchase Details
Closed on
Aug 1, 2017
Sold by
Findlater Earl and Findlater Iris
Bought by
Findlater Iris and Findlater Earl
Purchase Details
Closed on
Jan 10, 2002
Sold by
Lawson Mark
Bought by
Findlater Earl
Home Financials for this Owner
Home Financials are based on the most recent Mortgage that was taken out on this home.
Original Mortgage
$49,500
Interest Rate
6.84%
Purchase Details
Closed on
Nov 6, 2001
Sold by
Hud
Bought by
Lawson Mark
Purchase Details
Closed on
Jan 29, 2001
Sold by
Fleet Mtg Corp
Bought by
Hud
Purchase Details
Closed on
Aug 21, 2000
Sold by
Weaver Leslie A
Bought by
Fleet Mtg Corp and Fleet Real Estate Funding Corp
Purchase Details
Closed on
Nov 10, 1994
Sold by
Scicchitano Anna
Bought by
Weaver Leslie A
Create a Home Valuation Report for This Property
The Home Valuation Report is an in-depth analysis detailing your home's value as well as a comparison with similar homes in the area
Home Values in the Area
Average Home Value in this Area
Purchase History
| Date | Buyer | Sale Price | Title Company |
|---|---|---|---|
| Findlater Iris | -- | None Listed On Document | |
| Findlater Iris | -- | None Available | |
| Findlater Earl | $55,000 | -- | |
| Lawson Mark | $37,453 | -- | |
| Hud | -- | -- | |
| Fleet Mtg Corp | $4,900 | -- | |
| Weaver Leslie A | $55,000 | -- |
Source: Public Records
Mortgage History
| Date | Status | Borrower | Loan Amount |
|---|---|---|---|
| Previous Owner | Findlater Earl | $49,500 |
Source: Public Records
Tax History Compared to Growth
Tax History
| Year | Tax Paid | Tax Assessment Tax Assessment Total Assessment is a certain percentage of the fair market value that is determined by local assessors to be the total taxable value of land and additions on the property. | Land | Improvement |
|---|---|---|---|---|
| 2025 | $1,866 | $177,800 | $35,560 | $142,240 |
| 2024 | $1,866 | $177,800 | $35,560 | $142,240 |
| 2023 | $1,866 | $133,300 | $26,660 | $106,640 |
| 2022 | $819 | $88,300 | $26,660 | $61,640 |
| 2021 | $1,449 | $0 | $0 | $0 |
| 2020 | $1,449 | $0 | $0 | $0 |
| 2019 | $1,347 | $0 | $0 | $0 |
| 2018 | $969 | $0 | $0 | $0 |
| 2017 | $1,389 | $0 | $0 | $0 |
| 2016 | $969 | $0 | $0 | $0 |
| 2015 | $927 | $0 | $0 | $0 |
| 2014 | -- | $99,200 | $8,014 | $91,186 |
| 2012 | -- | $13,728 | $1,037 | $12,691 |
Source: Public Records
Map
Nearby Homes
- 5834 N Hope St
- 6001 N Mascher St
- 5832 N Mascher St
- 5815 N Front St
- 177 Linton St
- 160 Roselyn St
- 127 Fern St
- 150 Fern St
- 177 Roselyn St
- 249 W Calvert St
- 6022 N 2nd St
- 126 Rosemar St
- 163 W Chew Ave
- 139 Rosemar St
- 217 Furley St
- 248 W Champlost St
- 153 Rosemar St
- 5814 N American St
- 266 Linton St
- 183 Rosemar St
- 124 Widener St
- 120 Widener St
- 126 Widener St
- 118 Widener St
- 116 Widener St
- 128 Widener St
- 114 Widener St
- 130 Widener St
- 121 W Nedro Ave
- 119 W Nedro Ave
- 117 W Nedro Ave
- 125 W Nedro Ave
- 123 W Nedro Ave
- 115 W Nedro Ave
- 127 W Nedro Ave
- 132 Widener St
- 129 W Nedro Ave
- 112 Widener St
- 113 W Nedro Ave
- 111 W Nedro Ave