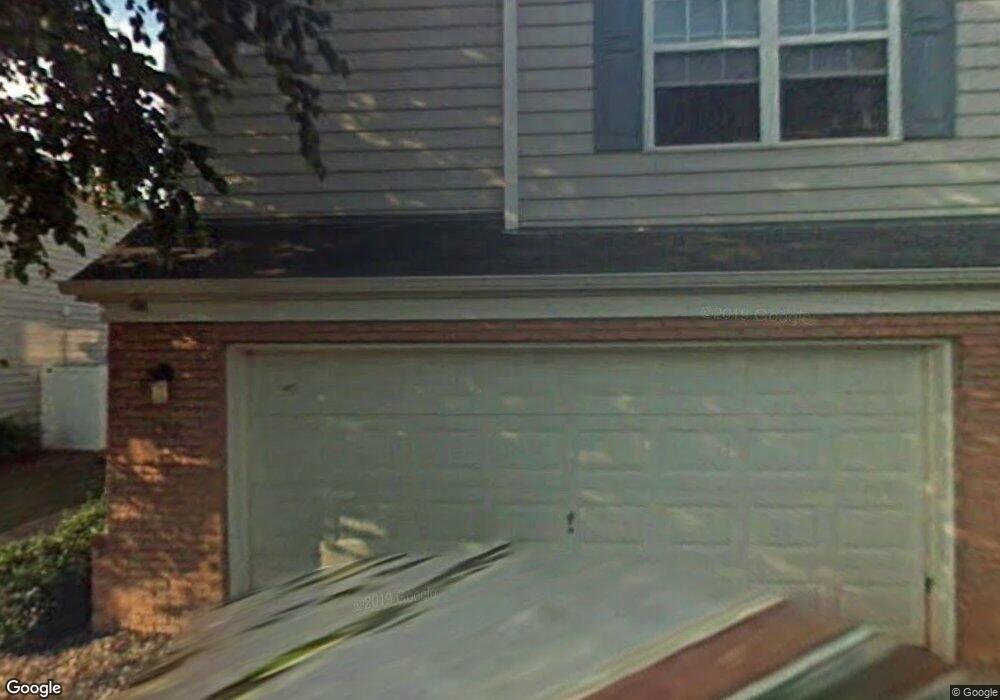
122 Windcroft Cir NW Unit 3C Acworth, GA 30101
Estimated Value: $309,170 - $327,000
3
Beds
3
Baths
1,265
Sq Ft
$248/Sq Ft
Est. Value
About This Home
This home is located at 122 Windcroft Cir NW Unit 3C, Acworth, GA 30101 and is currently estimated at $314,293, approximately $248 per square foot. 122 Windcroft Cir NW Unit 3C is a home located in Cobb County with nearby schools including Acworth Intermediate School, McCall Primary School, and Barber Middle School.
Ownership History
Date
Name
Owned For
Owner Type
Purchase Details
Closed on
May 25, 2001
Sold by
Colony Homes Llc
Bought by
Pulliam Daniel A
Current Estimated Value
Home Financials for this Owner
Home Financials are based on the most recent Mortgage that was taken out on this home.
Original Mortgage
$107,263
Interest Rate
6.98%
Mortgage Type
FHA
Purchase Details
Closed on
Apr 3, 2001
Sold by
Koenning Dennis C
Bought by
Commercial Federal Mtg Corp
Home Financials for this Owner
Home Financials are based on the most recent Mortgage that was taken out on this home.
Original Mortgage
$107,263
Interest Rate
6.98%
Mortgage Type
FHA
Purchase Details
Closed on
Dec 19, 1997
Sold by
Chicory Homes Inc
Bought by
Koenning Dennis C
Home Financials for this Owner
Home Financials are based on the most recent Mortgage that was taken out on this home.
Original Mortgage
$91,300
Interest Rate
7.16%
Mortgage Type
FHA
Create a Home Valuation Report for This Property
The Home Valuation Report is an in-depth analysis detailing your home's value as well as a comparison with similar homes in the area
Home Values in the Area
Average Home Value in this Area
Purchase History
| Date | Buyer | Sale Price | Title Company |
|---|---|---|---|
| Pulliam Daniel A | $117,500 | -- | |
| Commercial Federal Mtg Corp | $96,140 | -- | |
| Koenning Dennis C | $97,500 | -- |
Source: Public Records
Mortgage History
| Date | Status | Borrower | Loan Amount |
|---|---|---|---|
| Previous Owner | Pulliam Daniel A | $107,263 | |
| Previous Owner | Koenning Dennis C | $91,300 |
Source: Public Records
Tax History Compared to Growth
Tax History
| Year | Tax Paid | Tax Assessment Tax Assessment Total Assessment is a certain percentage of the fair market value that is determined by local assessors to be the total taxable value of land and additions on the property. | Land | Improvement |
|---|---|---|---|---|
| 2024 | $3,900 | $129,364 | $26,000 | $103,364 |
| 2023 | $3,533 | $117,188 | $26,000 | $91,188 |
| 2022 | $2,569 | $84,652 | $18,000 | $66,652 |
| 2021 | $2,171 | $71,524 | $16,000 | $55,524 |
| 2020 | $2,690 | $67,832 | $16,000 | $51,832 |
| 2019 | $1,985 | $65,396 | $14,000 | $51,396 |
| 2018 | $1,666 | $54,900 | $9,600 | $45,300 |
| 2017 | $1,578 | $54,900 | $9,600 | $45,300 |
| 2016 | $1,390 | $48,352 | $9,600 | $38,752 |
| 2015 | $1,172 | $39,776 | $7,200 | $32,576 |
| 2014 | $1,182 | $39,776 | $0 | $0 |
Source: Public Records
Map
Nearby Homes
- 834 Windcroft Cir NW Unit 3B
- 663 Windcroft Cir NW
- 159 Windcroft Ln NW Unit 3C
- 4527 Baker Grove Rd NW
- 606 Windcroft Cir NW
- 4517 Baker Grove Rd NW
- 3317 Grove Park Terrace NW Unit 1
- 4413 Grove Dr NW
- 4790 Julian Way
- 3157 Parfait Place Unit 2
- 3829 Rivers Run Trace NW
- 3157 Peartree Dr NW
- 4610 Old Cowan Rd
- 3943 Henry Ct
- 5052 Kathryn Glen Dr Unit 60
- 4518 Columbus Cir
- 4443 Toonigh Rd NW
- 120 Windcroft Cir NW
- 124 Windcroft Cir NW
- 126 Windcroft Cir NW Unit 3C
- 0 Baker Grove Rd Unit 7552053
- 0 Baker Grove Rd Unit 7533212
- 0 Baker Grove Rd Unit 7463391
- 0 Baker Grove Rd Unit 7238887
- 0 Baker Grove Rd Unit 3216828
- 0 Baker Grove Rd Unit 8298109
- 0 Baker Grove Rd Unit 8238514
- 0 Baker Grove Rd Unit 8781979
- 0 Baker Grove Rd Unit 8627128
- 0 Baker Grove Rd Unit 8679936
- 0 Baker Grove Rd
- 160 Windcroft Cir NW
- 162 Windcroft Cir NW Unit 1A
- 101 Windcroft Cir NW
- 153 Windcroft Cir NW
- 141 Windcroft Cir NW
- 984 Windcroft Cir NW