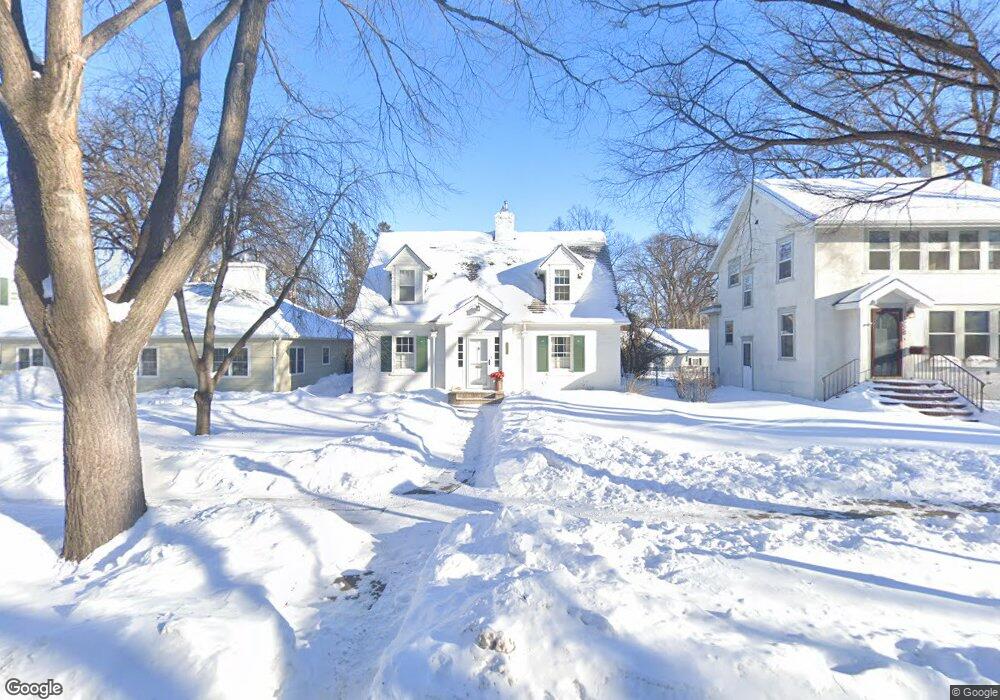
1220 8th St S Fargo, ND 58103
Hawthorne NeighborhoodEstimated Value: $424,000 - $480,974
3
Beds
2
Baths
2,947
Sq Ft
$154/Sq Ft
Est. Value
About This Home
This home is located at 1220 8th St S, Fargo, ND 58103 and is currently estimated at $453,744, approximately $153 per square foot. 1220 8th St S is a home located in Cass County with nearby schools including Clara Barton Elementary School, Ben Franklin Middle School, and South High School.
Ownership History
Date
Name
Owned For
Owner Type
Purchase Details
Closed on
Dec 10, 2020
Sold by
Wolsky Gary J and Wolsky Claudia J
Bought by
Bjoralt Nathan and Bjoralt Casey
Current Estimated Value
Home Financials for this Owner
Home Financials are based on the most recent Mortgage that was taken out on this home.
Original Mortgage
$298,400
Outstanding Balance
$266,139
Interest Rate
2.8%
Mortgage Type
New Conventional
Estimated Equity
$187,605
Purchase Details
Closed on
Jun 12, 2009
Sold by
Wolsky Gary J and Wolsky Claudia J
Bought by
Wolsky Gary J and Wolsky Claudia J
Purchase Details
Closed on
Jan 19, 2009
Sold by
Wolsky Gary J and Wolsky Claudi J
Bought by
Wolsky Gary J and Wolsky Claudia J
Home Financials for this Owner
Home Financials are based on the most recent Mortgage that was taken out on this home.
Original Mortgage
$212,000
Interest Rate
5.03%
Mortgage Type
New Conventional
Create a Home Valuation Report for This Property
The Home Valuation Report is an in-depth analysis detailing your home's value as well as a comparison with similar homes in the area
Home Values in the Area
Average Home Value in this Area
Purchase History
| Date | Buyer | Sale Price | Title Company |
|---|---|---|---|
| Bjoralt Nathan | $373,000 | The Title Co Residential | |
| Wolsky Gary J | -- | -- | |
| Wolsky Gary J | -- | -- |
Source: Public Records
Mortgage History
| Date | Status | Borrower | Loan Amount |
|---|---|---|---|
| Open | Bjoralt Nathan | $298,400 | |
| Previous Owner | Wolsky Gary J | $212,000 |
Source: Public Records
Tax History Compared to Growth
Tax History
| Year | Tax Paid | Tax Assessment Tax Assessment Total Assessment is a certain percentage of the fair market value that is determined by local assessors to be the total taxable value of land and additions on the property. | Land | Improvement |
|---|---|---|---|---|
| 2024 | $6,398 | $218,550 | $33,600 | $184,950 |
| 2023 | $5,834 | $218,550 | $33,600 | $184,950 |
| 2022 | $5,392 | $198,700 | $33,600 | $165,100 |
| 2021 | $4,604 | $172,800 | $33,600 | $139,200 |
| 2020 | $3,909 | $146,850 | $33,600 | $113,250 |
| 2019 | $3,602 | $136,850 | $21,150 | $115,700 |
| 2018 | $3,555 | $136,850 | $21,150 | $115,700 |
| 2017 | $3,414 | $132,850 | $21,150 | $111,700 |
| 2016 | $3,040 | $129,000 | $21,150 | $107,850 |
| 2015 | $3,026 | $120,400 | $13,050 | $107,350 |
| 2014 | $2,821 | $109,450 | $13,050 | $96,400 |
| 2013 | $2,824 | $109,450 | $13,050 | $96,400 |
Source: Public Records
Map
Nearby Homes
- 1301 10th St S
- 911 8th St S
- 403 11th Ave S Unit 2
- 1020 9th Ave S
- 1208 University Dr S
- 820 10th St S Unit C20
- 1124 University Dr S
- 1112 University Dr S
- 1439 10th St S
- 1425 11th St S
- 910 University Dr S
- 344 9th Ave S
- 1118 8th Ave S
- 605 7th St S Unit 2
- 1314 14th St S
- 502 8th St S Unit 5
- 502 8th St S Unit 3
- 502 8th St S Unit 1
- 502 8th St S Unit 2
- 502 8th St S Unit 4