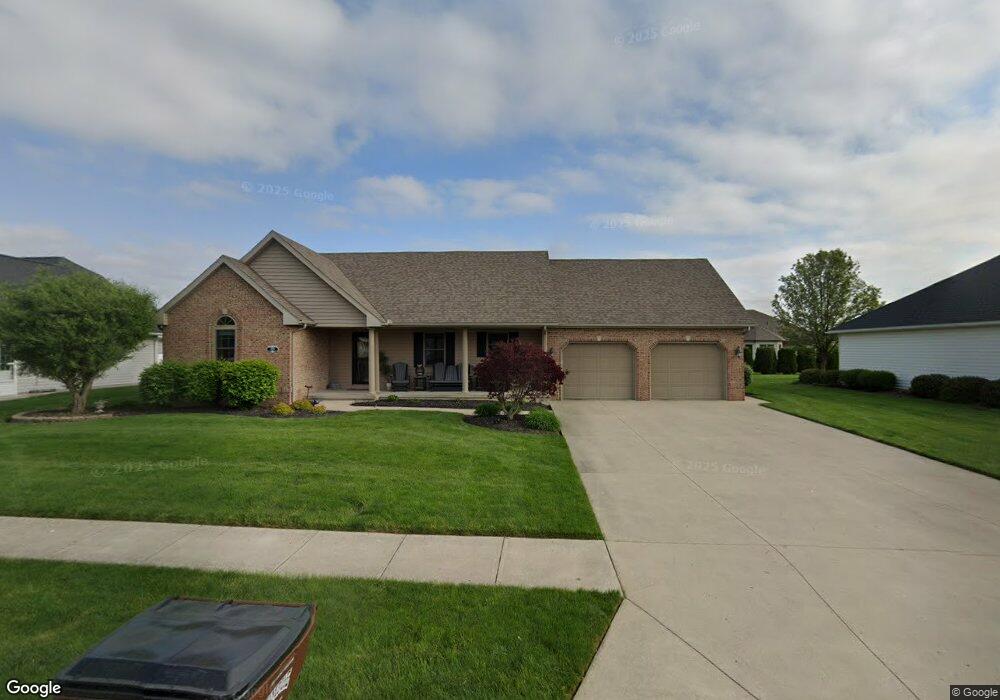
1220 Christina St Delphos, OH 45833
Estimated Value: $329,000 - $351,931
3
Beds
3
Baths
1,810
Sq Ft
$189/Sq Ft
Est. Value
About This Home
This home is located at 1220 Christina St, Delphos, OH 45833 and is currently estimated at $341,733, approximately $188 per square foot. 1220 Christina St is a home located in Allen County with nearby schools including Delphos St. John's High School and Delphos St. John's Elementary School.
Ownership History
Date
Name
Owned For
Owner Type
Purchase Details
Closed on
Sep 26, 2012
Sold by
Syphrit Jill C
Bought by
Warnecke Joseph L and Warnecke Sherry R
Current Estimated Value
Purchase Details
Closed on
Mar 10, 2012
Sold by
Carder Michael E and Carder Pamela L
Bought by
Warnecke Joseph L and Warnecke Sherry R
Purchase Details
Closed on
Sep 6, 2001
Sold by
Spieles Frankline
Bought by
Warnecke Joseph L and Warnecke Sherry R
Home Financials for this Owner
Home Financials are based on the most recent Mortgage that was taken out on this home.
Original Mortgage
$120,000
Interest Rate
7.03%
Mortgage Type
New Conventional
Purchase Details
Closed on
Jan 2, 2001
Sold by
Exc Jean M Grothause
Bought by
Spieles Franklin E and Spieles Dolores N
Create a Home Valuation Report for This Property
The Home Valuation Report is an in-depth analysis detailing your home's value as well as a comparison with similar homes in the area
Home Values in the Area
Average Home Value in this Area
Purchase History
| Date | Buyer | Sale Price | Title Company |
|---|---|---|---|
| Warnecke Joseph L | $5,000 | Attorney | |
| Warnecke Joseph L | $235,000 | Attorney | |
| Warnecke Joseph L | $40,000 | Attorney | |
| Warnecke Joseph L | $179,900 | -- | |
| Spieles Franklin E | $18,500 | -- |
Source: Public Records
Mortgage History
| Date | Status | Borrower | Loan Amount |
|---|---|---|---|
| Closed | Warnecke Joseph L | $120,000 |
Source: Public Records
Tax History Compared to Growth
Tax History
| Year | Tax Paid | Tax Assessment Tax Assessment Total Assessment is a certain percentage of the fair market value that is determined by local assessors to be the total taxable value of land and additions on the property. | Land | Improvement |
|---|---|---|---|---|
| 2024 | $3,501 | $114,250 | $13,550 | $100,700 |
| 2023 | $2,729 | $84,640 | $10,050 | $74,590 |
| 2022 | $2,797 | $84,640 | $10,050 | $74,590 |
| 2021 | $2,809 | $84,640 | $10,050 | $74,590 |
| 2020 | $2,286 | $71,750 | $9,520 | $62,230 |
| 2019 | $2,286 | $71,750 | $9,520 | $62,230 |
| 2018 | $2,300 | $71,750 | $9,520 | $62,230 |
| 2017 | $2,117 | $65,380 | $9,520 | $55,860 |
| 2016 | $2,130 | $65,380 | $9,520 | $55,860 |
| 2015 | $2,109 | $65,380 | $9,520 | $55,860 |
| 2014 | $2,211 | $66,860 | $9,140 | $57,720 |
| 2013 | $2,215 | $66,860 | $9,140 | $57,720 |
Source: Public Records
Map
Nearby Homes
- 1220 Rose Anna Dr
- 1303 Carolyn Dr
- 650 E 6th St
- 810 N Franklin St
- 628 N Pierce St
- 704 N Franklin St
- 914 E 3rd St
- 903 E 3rd St
- 821 E 3rd St
- 610 N Washington St
- 405 N Franklin St
- 633 E 2nd St
- 210 E 3rd St
- 503 W 6th St
- 604 W 6th St
- 616 W 5th St
- 409 N Bredeick St
- 221 S Main St
- 424 S Canal St
- 7110 Elida Rd
- 1210 Christina St
- 1230 Christina St
- 1221 Joshua St
- 1211 Joshua St
- 1221 Christina St
- 1240 Christina St
- 1520 Carolyn Dr
- 1211 Christina St
- 1231 Christina St
- 1241 Joshua St
- 1590 Carolyn Dr
- 1201 Christina St
- 1241 Christina St
- 1220 Joshua St
- 1221 Rose Anna Dr
- 1210 Joshua St
- 1230 Joshua St
- 1211 Rose Anna Dr
- 1300 Christina St