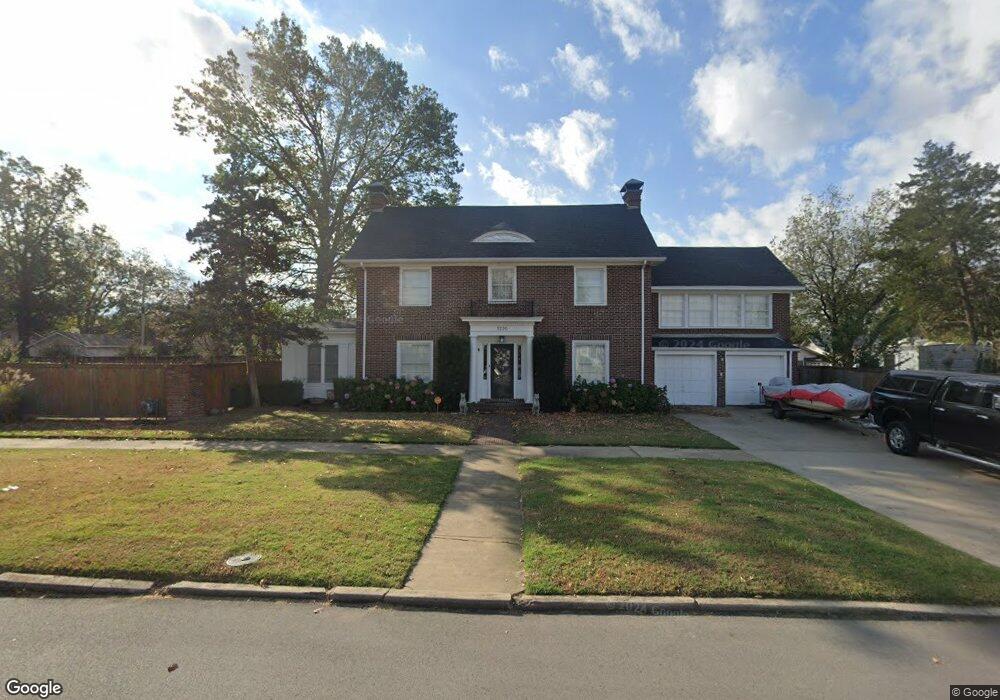
1220 E 9th St Okmulgee, OK 74447
Estimated Value: $201,183 - $339,000
4
Beds
4
Baths
3,253
Sq Ft
$76/Sq Ft
Est. Value
About This Home
This home is located at 1220 E 9th St, Okmulgee, OK 74447 and is currently estimated at $248,546, approximately $76 per square foot. 1220 E 9th St is a home located in Okmulgee County with nearby schools including Okmulgee Primary School, Dunbar Elementary School, and Okmulgee Middle School.
Ownership History
Date
Name
Owned For
Owner Type
Purchase Details
Closed on
Apr 3, 2013
Sold by
Mccarty Michael and Mccarty Jade
Bought by
Thompson Brian Patrick and Acton Jessice Leigh
Current Estimated Value
Home Financials for this Owner
Home Financials are based on the most recent Mortgage that was taken out on this home.
Original Mortgage
$151,098
Outstanding Balance
$105,214
Interest Rate
3.25%
Mortgage Type
FHA
Estimated Equity
$143,332
Purchase Details
Closed on
Nov 14, 2007
Sold by
Mitchell Victor
Bought by
Mccarty Michael
Purchase Details
Closed on
Sep 18, 1996
Sold by
Mcclendon James and Mcclendon Shari
Bought by
Wise Christopher and Wise Wife
Create a Home Valuation Report for This Property
The Home Valuation Report is an in-depth analysis detailing your home's value as well as a comparison with similar homes in the area
Home Values in the Area
Average Home Value in this Area
Purchase History
| Date | Buyer | Sale Price | Title Company |
|---|---|---|---|
| Thompson Brian Patrick | $163,000 | None Available | |
| Mccarty Michael | $123,000 | None Available | |
| Wise Christopher | $100,000 | -- |
Source: Public Records
Mortgage History
| Date | Status | Borrower | Loan Amount |
|---|---|---|---|
| Open | Thompson Brian Patrick | $151,098 |
Source: Public Records
Tax History
| Year | Tax Paid | Tax Assessment Tax Assessment Total Assessment is a certain percentage of the fair market value that is determined by local assessors to be the total taxable value of land and additions on the property. | Land | Improvement |
|---|---|---|---|---|
| 2025 | $892 | $10,738 | $1,440 | $9,298 |
| 2024 | $853 | $10,425 | $1,440 | $8,985 |
| 2023 | $1,702 | $20,991 | $1,440 | $19,551 |
| 2022 | $1,690 | $20,991 | $1,440 | $19,551 |
| 2021 | $1,768 | $20,991 | $1,440 | $19,551 |
| 2020 | $1,812 | $21,487 | $1,440 | $20,047 |
| 2019 | $1,783 | $21,186 | $1,440 | $19,746 |
| 2018 | $1,751 | $20,569 | $1,440 | $19,129 |
| 2017 | $1,735 | $19,589 | $1,440 | $18,149 |
| 2016 | $1,702 | $19,174 | $1,440 | $17,734 |
| 2015 | $1,681 | $19,523 | $1,440 | $18,083 |
| 2014 | $1,695 | $19,560 | $1,440 | $18,120 |
Source: Public Records
Map
Nearby Homes
Your Personal Tour Guide
Ask me questions while you tour the home.