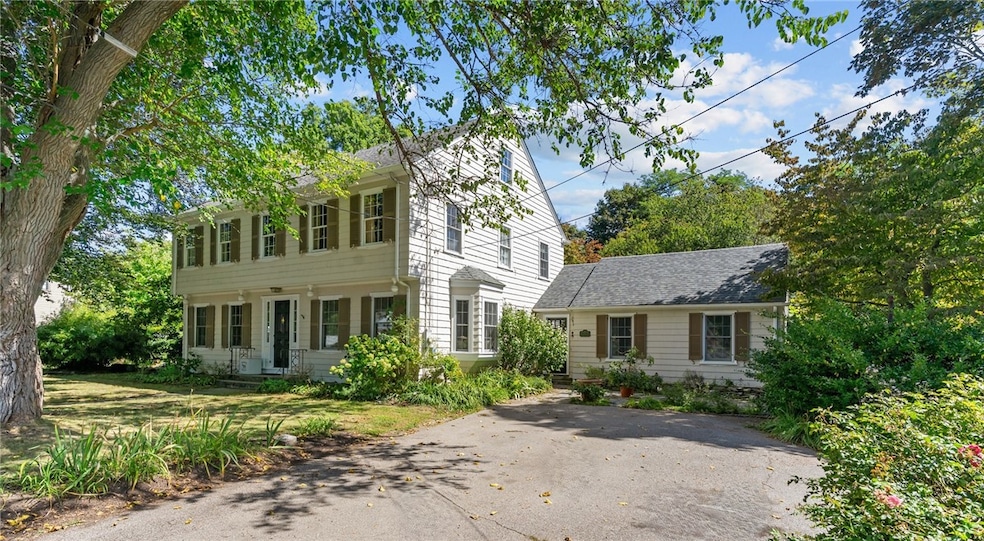
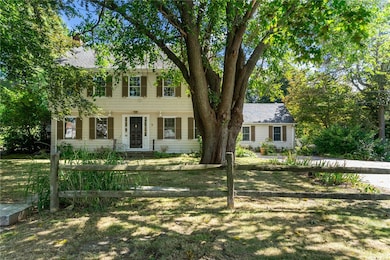

1220 Hope St Bristol, RI 02809
Bristol Highlands NeighborhoodEstimated payment $5,467/month
Highlights
- Popular Property
- Golf Course Community
- Colonial Architecture
- Marina
- 0.67 Acre Lot
- Wood Flooring
About This Home
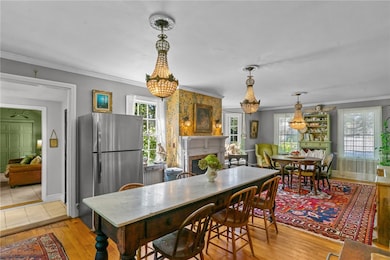
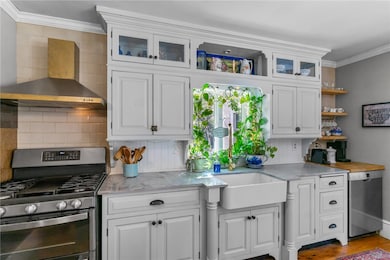
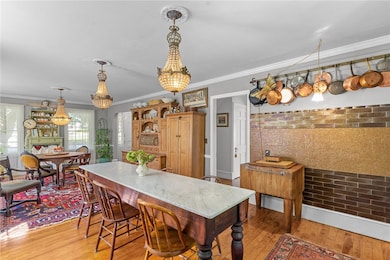
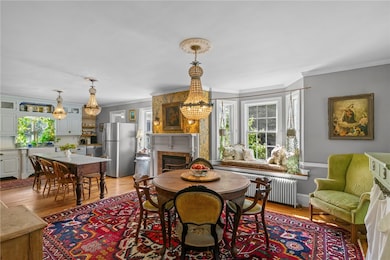
Welcome to 1220 Hope Street nestled in beautiful Bristol, RI. This incredibly charming classic Colonial will have you at "hello"! Fall in love with the elegance of this timeless home filled with many original architectural details and hardwood flooring throughout. Interior is warm and inviting offering a traditional central hall floor plan with kitchen and living room arranged off the main entrance. Front doorway into mudroom provides a practical transitional space leading in from driveway & the expansive backyard with delightful perennials designated as a Certified Wildlife Habitat. First level features a stunning eat-in-kitchen w/gas fireplace & window seat, expansive living room w/wood burning fireplace leading to side sun porch & generous family room w/private bathroom originally designed and easily used as a first floor primary or in-law. Second level offers the perfect blend of privacy and comfort with four very spacious bedrooms, large walk-in-closet, custom updated full bathroom & delightful window seat with built-ins. Finished third level extends the entire length of the home and offers endless possibilities as bonus room, additional bedroom, studio or home office. Insulation recently added by RISE! Discover living in this vibrant coastal community known for art galleries, antique shops, casual & fine dining, marinas, pickle ball courts, Colt Park, East Bay Bike Path & parade route featuring America's Oldest 4th of July Celebration. Make this your home sweet home!
Listing Agent
RE/MAX River's Edge - Bristol License #RES.0040828 Listed on: 09/29/2025

Home Details
Home Type
- Single Family
Est. Annual Taxes
- $8,690
Year Built
- Built in 1930
Lot Details
- 0.67 Acre Lot
- Property is zoned R-10
Home Design
- Colonial Architecture
- Combination Foundation
- Clapboard
Interior Spaces
- 3,438 Sq Ft Home
- 2-Story Property
- 2 Fireplaces
- Gas Fireplace
- Mud Room
- Storage Room
- Utility Room
Kitchen
- Oven
- Range
- Microwave
- Dishwasher
Flooring
- Wood
- Ceramic Tile
Bedrooms and Bathrooms
- 4 Bedrooms
Laundry
- Laundry Room
- Dryer
- Washer
Unfinished Basement
- Basement Fills Entire Space Under The House
- Interior and Exterior Basement Entry
Parking
- 6 Parking Spaces
- No Garage
Outdoor Features
- Patio
- Porch
Utilities
- No Cooling
- Heating System Uses Gas
- Baseboard Heating
- 100 Amp Service
- Electric Water Heater
Listing and Financial Details
- Tax Lot 11
- Assessor Parcel Number 1220HOPESTBRIS
Community Details
Amenities
- Shops
- Restaurant
- Public Transportation
Recreation
- Marina
- Golf Course Community
- Tennis Courts
- Recreation Facilities
Map
Home Values in the Area
Average Home Value in this Area
Tax History
| Year | Tax Paid | Tax Assessment Tax Assessment Total Assessment is a certain percentage of the fair market value that is determined by local assessors to be the total taxable value of land and additions on the property. | Land | Improvement |
|---|---|---|---|---|
| 2025 | $8,053 | $838,900 | $208,300 | $630,600 |
| 2024 | $7,736 | $559,800 | $173,600 | $386,200 |
| 2023 | $7,479 | $559,800 | $173,600 | $386,200 |
| 2022 | $7,277 | $559,800 | $173,600 | $386,200 |
| 2021 | $6,776 | $471,200 | $158,200 | $313,000 |
| 2020 | $6,630 | $471,200 | $158,200 | $313,000 |
| 2019 | $6,465 | $471,200 | $158,200 | $313,000 |
| 2018 | $6,964 | $452,800 | $155,600 | $297,200 |
| 2017 | $5,971 | $400,200 | $146,400 | $253,800 |
| 2016 | $5,911 | $400,200 | $146,400 | $253,800 |
| 2015 | $5,615 | $400,200 | $146,400 | $253,800 |
| 2014 | $5,315 | $406,940 | $142,900 | $264,040 |
Property History
| Date | Event | Price | List to Sale | Price per Sq Ft |
|---|---|---|---|---|
| 09/29/2025 09/29/25 | For Sale | $899,900 | -- | $262 / Sq Ft |
Purchase History
| Date | Type | Sale Price | Title Company |
|---|---|---|---|
| Quit Claim Deed | -- | -- | |
| Quit Claim Deed | -- | None Available | |
| Quit Claim Deed | -- | None Available | |
| Quit Claim Deed | -- | None Available | |
| Deed | $253,000 | -- | |
| Deed | $253,000 | -- |
Mortgage History
| Date | Status | Loan Amount | Loan Type |
|---|---|---|---|
| Previous Owner | $261,000 | Unknown | |
| Previous Owner | $260,000 | No Value Available | |
| Previous Owner | $252,000 | No Value Available |
Source: State-Wide MLS
MLS Number: 1396436
APN: BRIS-000103-000000-000011
Disclaimer: Certain information contained herein is derived from information provided by parties other than Homes.com. All information provided is deemed reliable, but is not guaranteed to be accurate and should be independently verified.
![]() IDX information is provided exclusively for personal, non-commercial use, and may not be used for any purpose other than to identify prospective properties consumers may be interested in purchasing. Information is deemed reliable but not guaranteed.
IDX information is provided exclusively for personal, non-commercial use, and may not be used for any purpose other than to identify prospective properties consumers may be interested in purchasing. Information is deemed reliable but not guaranteed.
Copyright © 2025 State-Wide MLS, Inc. All rights reserved.
- 1 Knowlton Ct
- 7 Knowlton Ct
- 3 Knowlton Ct
- 5 Knowlton Ct
- 27 Hamlet Ct
- 40 Aaron Ave
- 61 Mulberry Rd
- 2 Cherry Ln
- 143 Windward Ln
- 0 Surf Dr
- 669 Metacom Ave Unit 17
- 148 Windward Ln
- 200 Arboretum Ln
- 677 Metacom Ave Unit 59
- 94 Windward Ln
- 683 Metacom Ave Unit 79
- 17 Shore Rd
- 3 Chestnut St
- 35 Bagy Wrinkle Cove
- 53 Bagy Wrinkle Cove
- 143 Windward Ln
- 21 Clifton Rd
- 35 Fales Rd
- 889 Hope St Unit 3
- 700 Metacom Ave
- 825 Hope St
- 426 Metacom Ave Unit 2
- 426 Metacom Ave Unit 1
- 81 Bay View Ave Unit 2
- 81 Bayview Ave Unit 2
- 624 Metacom Ave
- 413 High St
- 11 Roma St Unit 1
- 706 Hope St Unit 2
- 390 Metacom Ave Unit 212
- 390 Metacom Ave Unit 206
- 692 Hope St Unit 2
- 69 Franklin St Unit 3 Bedroom Downtown
- 92 Franklin St
- 471 Wood St