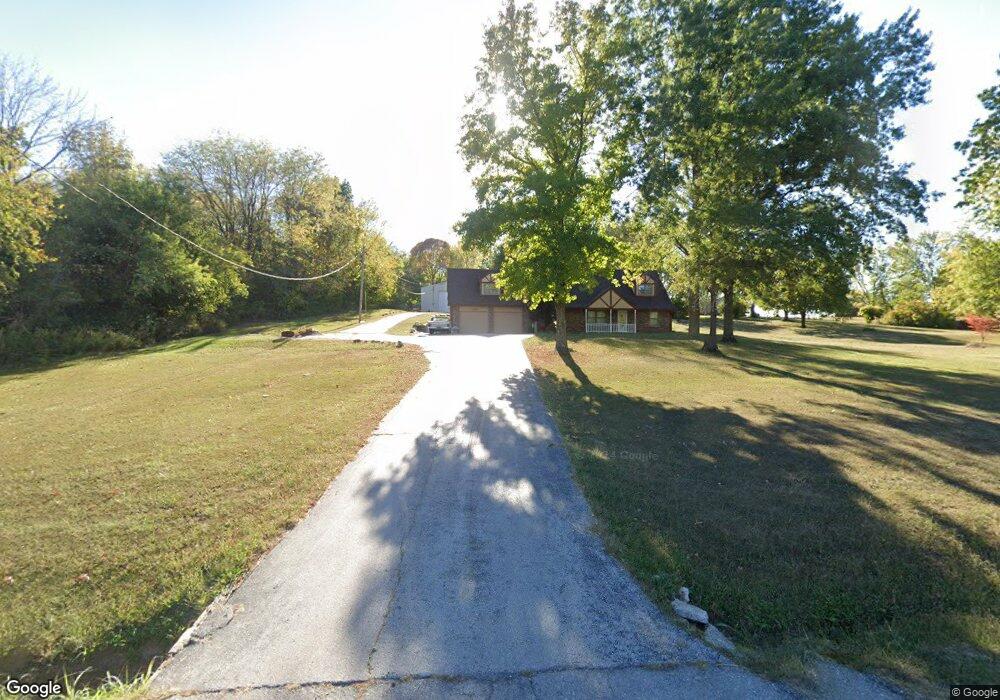
1220 N State Route 7 Independence, MO 64056
Rainbow NeighborhoodEstimated Value: $343,000 - $465,000
3
Beds
2
Baths
2,423
Sq Ft
$160/Sq Ft
Est. Value
About This Home
This home is located at 1220 N State Route 7, Independence, MO 64056 and is currently estimated at $388,185, approximately $160 per square foot. 1220 N State Route 7 is a home located in Jackson County with nearby schools including Fort Osage High School.
Ownership History
Date
Name
Owned For
Owner Type
Purchase Details
Closed on
Apr 18, 2007
Sold by
Beemer Donald D and Beemer Carolyn L
Bought by
Cooper Gary and Cooper Theresa
Current Estimated Value
Purchase Details
Closed on
Jun 2, 2000
Sold by
Jean Johnson Rufus Scott
Bought by
Beemer Donald D and Beemer Carolyn L
Home Financials for this Owner
Home Financials are based on the most recent Mortgage that was taken out on this home.
Original Mortgage
$30,000
Interest Rate
8.3%
Mortgage Type
Purchase Money Mortgage
Purchase Details
Closed on
May 31, 1997
Sold by
Czeschin Earl and Czeschin Cindy
Bought by
Johnson Queens S and Johnson Colleen J
Home Financials for this Owner
Home Financials are based on the most recent Mortgage that was taken out on this home.
Original Mortgage
$33,000
Interest Rate
8.17%
Create a Home Valuation Report for This Property
The Home Valuation Report is an in-depth analysis detailing your home's value as well as a comparison with similar homes in the area
Home Values in the Area
Average Home Value in this Area
Purchase History
| Date | Buyer | Sale Price | Title Company |
|---|---|---|---|
| Cooper Gary | -- | Heart Of America Title & Esc | |
| Beemer Donald D | -- | Heart Of America Title Inc | |
| Johnson Queens S | -- | -- |
Source: Public Records
Mortgage History
| Date | Status | Borrower | Loan Amount |
|---|---|---|---|
| Previous Owner | Beemer Donald D | $30,000 | |
| Previous Owner | Johnson Queens S | $33,000 |
Source: Public Records
Tax History Compared to Growth
Tax History
| Year | Tax Paid | Tax Assessment Tax Assessment Total Assessment is a certain percentage of the fair market value that is determined by local assessors to be the total taxable value of land and additions on the property. | Land | Improvement |
|---|---|---|---|---|
| 2025 | $4,279 | $47,240 | $6,164 | $41,076 |
| 2024 | $4,259 | $53,888 | $7,190 | $46,698 |
| 2023 | $4,259 | $53,888 | $5,820 | $48,068 |
| 2022 | $2,972 | $35,720 | $2,689 | $33,031 |
| 2021 | $2,971 | $35,720 | $2,689 | $33,031 |
| 2020 | $2,637 | $31,279 | $2,689 | $28,590 |
| 2019 | $2,612 | $31,279 | $2,689 | $28,590 |
| 2018 | $2,442 | $29,065 | $5,951 | $23,114 |
| 2017 | $2,181 | $29,065 | $5,951 | $23,114 |
| 2016 | $2,181 | $28,337 | $3,247 | $25,090 |
| 2014 | $2,193 | $28,337 | $3,247 | $25,090 |
Source: Public Records
Map
Nearby Homes
- 1622 N Charlton Rd
- 701 N Bly Rd
- 1515 N Elsea Smith Rd
- 512 N Bly Rd
- 26820 E Heidelberger Rd
- 0 E Blue Mills Rd Unit 1992136
- 1330 N Lake City Valley Rd
- 27900 E Carswell Rd
- 27704 E Us Highway 24
- 2801 N Lentz Rd
- 24445 E Truman Rd
- 1001 S Riverview Ave S
- 23504 E 11th Terrace S
- 20912 E Us Highway 24
- 1105 N Powell Rd
- 1401 N Powell Rd
- 0 Tbd Rd Unit HMS2511302
- 20408 E 15th Terrace N
- 3410 N Perrin Rd
- 20213 E 14th Terrace Ct N
- 1221 N Bill Johnson Rd
- 1206 N State Route 7
- 1316 N State Route 7
- 1315 N Bill Johnson Rd
- 1211 N Bill Johnson Rd
- 1205 N Bill Johnson Rd
- 1250 N Bill Johnson Rd
- 1201 N Bill Johnson Rd
- 0 Bill Johnson Rd
- 1150 N Bill Johnson Rd
- 1226 N Bill Johnson Rd
- 1200 N Bill Johnson Rd
- 1300 N Bill Johnson Rd
- 1146 N Bill Johnson Rd
- 1400 N Bill Johnson Rd
- 1141 N Bill Johnson Rd
- 1140 N Bill Johnson Rd
- 1140 N Bill Johnson Rd
- 1501 N State Route 7
- 1416 N State Route 7