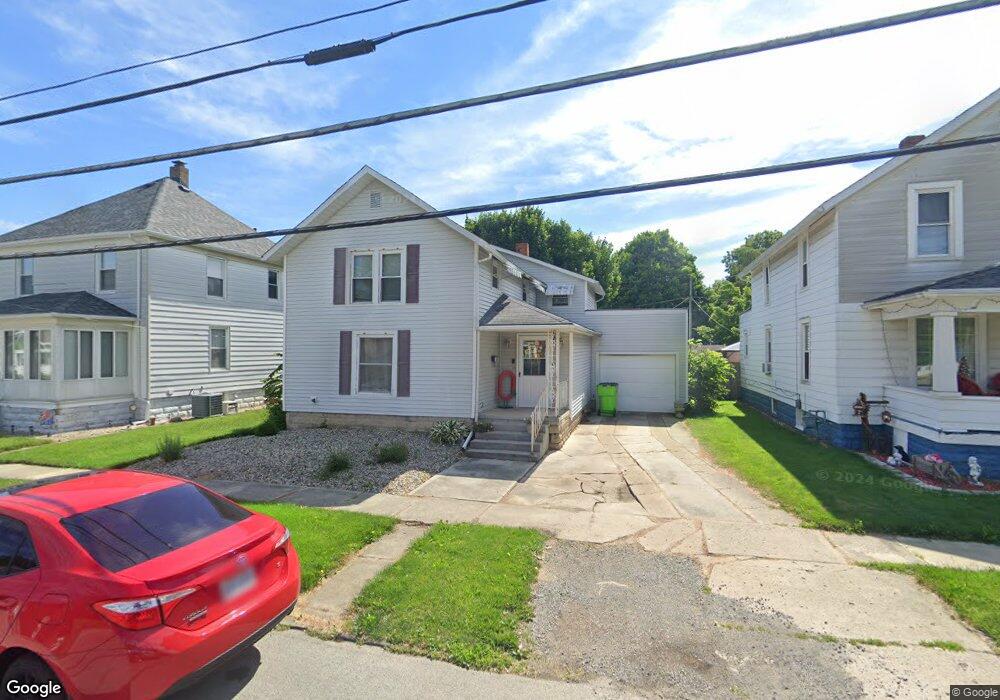
1220 N Union St Fostoria, OH 44830
Estimated Value: $113,000 - $135,000
3
Beds
2
Baths
1,775
Sq Ft
$71/Sq Ft
Est. Value
About This Home
This home is located at 1220 N Union St, Fostoria, OH 44830 and is currently estimated at $126,363, approximately $71 per square foot. 1220 N Union St is a home located in Seneca County with nearby schools including Fostoria Intermediate Elementary School and Fostoria Junior/Senior High School.
Ownership History
Date
Name
Owned For
Owner Type
Purchase Details
Closed on
Jan 28, 2021
Sold by
Widmer Kory L and Gegenheimer Kory L
Bought by
Krieger Helms Sydnee J
Current Estimated Value
Home Financials for this Owner
Home Financials are based on the most recent Mortgage that was taken out on this home.
Original Mortgage
$76,000
Outstanding Balance
$67,938
Interest Rate
2.67%
Mortgage Type
New Conventional
Estimated Equity
$58,425
Purchase Details
Closed on
Dec 22, 2011
Sold by
Wolph Jared M and Wolph Trina L
Bought by
Gegenheimer Kory L
Home Financials for this Owner
Home Financials are based on the most recent Mortgage that was taken out on this home.
Original Mortgage
$45,191
Interest Rate
5.5%
Mortgage Type
FHA
Purchase Details
Closed on
Aug 2, 1999
Sold by
Collins Betty C
Bought by
Wolph Jared M
Purchase Details
Closed on
Jun 4, 1996
Sold by
Collins Collins F F and Collins Betty C
Bought by
Collins Betty C
Create a Home Valuation Report for This Property
The Home Valuation Report is an in-depth analysis detailing your home's value as well as a comparison with similar homes in the area
Home Values in the Area
Average Home Value in this Area
Purchase History
| Date | Buyer | Sale Price | Title Company |
|---|---|---|---|
| Krieger Helms Sydnee J | $80,000 | None Available | |
| Gegenheimer Kory L | $30,800 | Assured Title | |
| Wolph Jared M | $47,000 | -- | |
| Collins Betty C | -- | -- |
Source: Public Records
Mortgage History
| Date | Status | Borrower | Loan Amount |
|---|---|---|---|
| Open | Krieger Helms Sydnee J | $76,000 | |
| Previous Owner | Gegenheimer Kory L | $45,191 |
Source: Public Records
Tax History Compared to Growth
Tax History
| Year | Tax Paid | Tax Assessment Tax Assessment Total Assessment is a certain percentage of the fair market value that is determined by local assessors to be the total taxable value of land and additions on the property. | Land | Improvement |
|---|---|---|---|---|
| 2024 | $1,288 | $25,610 | $2,230 | $23,380 |
| 2023 | $1,291 | $25,610 | $2,230 | $23,380 |
| 2022 | $1,072 | $18,930 | $1,930 | $17,000 |
| 2021 | $1,095 | $18,930 | $1,930 | $17,000 |
| 2020 | $1,100 | $18,921 | $1,925 | $16,996 |
| 2019 | $1,070 | $18,267 | $1,859 | $16,408 |
| 2018 | $1,091 | $18,267 | $1,859 | $16,408 |
| 2017 | $1,027 | $18,267 | $1,859 | $16,408 |
| 2016 | $981 | $18,417 | $2,051 | $16,366 |
| 2015 | $964 | $18,417 | $2,051 | $16,366 |
| 2014 | $918 | $18,417 | $2,051 | $16,366 |
| 2013 | $1,079 | $20,021 | $2,230 | $17,791 |
Source: Public Records
Map
Nearby Homes
- 1324 N Union St
- 375 Thomas St
- 900 N Countyline St
- 892 N Countyline St
- 931 N Union St
- 723 N Union St
- 901 Central Ave
- 727 Eisenhower Dr
- 633 Maple St
- 520 N Union St
- 827 Buckley St
- 540 N Poplar St
- 220 E High St
- 711 Circle Dr
- 203 N Union St
- 509 College Ave
- 481 Beverly Dr
- 348 W South St
- 634 W Tiffin St
- 351 W South St