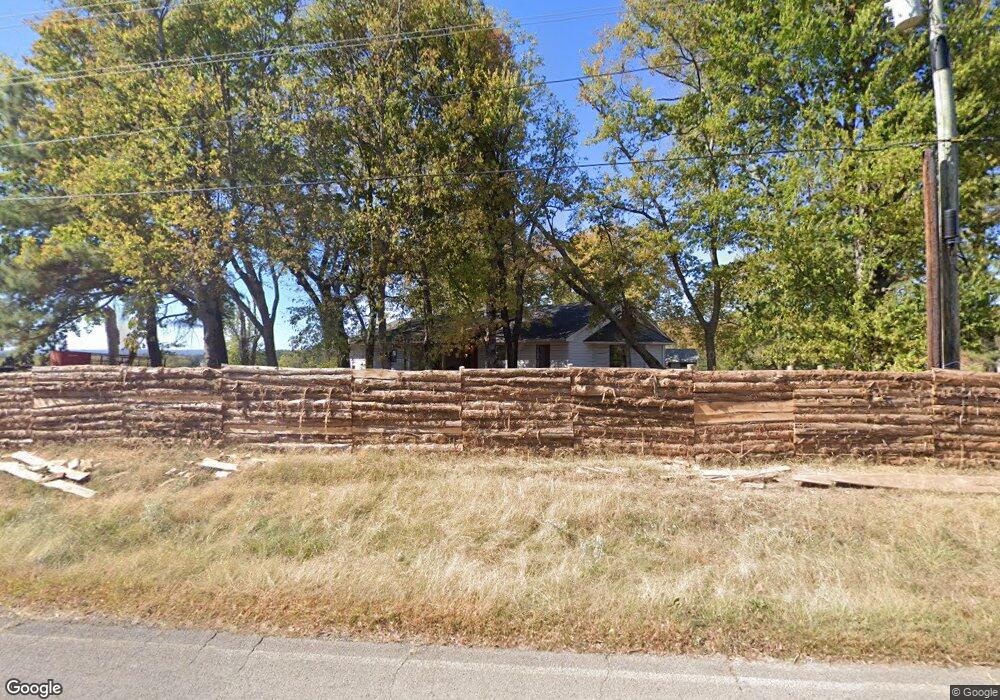
1220 Oak Grove Rd van Buren, AR 72956
Estimated Value: $221,000 - $459,000
--
Bed
3
Baths
2,908
Sq Ft
$113/Sq Ft
Est. Value
About This Home
This home is located at 1220 Oak Grove Rd, van Buren, AR 72956 and is currently estimated at $328,579, approximately $112 per square foot. 1220 Oak Grove Rd is a home located in Crawford County with nearby schools including James R. Tate Elementary School, Butterfield Trail Middle School, and Van Buren High School.
Ownership History
Date
Name
Owned For
Owner Type
Purchase Details
Closed on
Mar 8, 2023
Sold by
Rivers Edge Investments Llc
Bought by
Willis Billy E and Willis Janetta D
Current Estimated Value
Home Financials for this Owner
Home Financials are based on the most recent Mortgage that was taken out on this home.
Original Mortgage
$193,800
Outstanding Balance
$28,743
Interest Rate
5.17%
Mortgage Type
Credit Line Revolving
Estimated Equity
$299,836
Purchase Details
Closed on
Feb 24, 2022
Sold by
Hays Alva E
Bought by
Rivers Edge Investments Llc
Purchase Details
Closed on
Mar 27, 2012
Sold by
Sallee Michael R
Bought by
Hays Alvy E
Home Financials for this Owner
Home Financials are based on the most recent Mortgage that was taken out on this home.
Original Mortgage
$100,000
Interest Rate
3.92%
Mortgage Type
Commercial
Purchase Details
Closed on
May 10, 1999
Bought by
Shirley-Sallee
Create a Home Valuation Report for This Property
The Home Valuation Report is an in-depth analysis detailing your home's value as well as a comparison with similar homes in the area
Home Values in the Area
Average Home Value in this Area
Purchase History
| Date | Buyer | Sale Price | Title Company |
|---|---|---|---|
| Willis Billy E | $228,000 | None Listed On Document | |
| Rivers Edge Investments Llc | $170,500 | Brister M Sean | |
| Hays Alvy E | $245,666 | None Available | |
| Shirley-Sallee | $133,000 | -- |
Source: Public Records
Mortgage History
| Date | Status | Borrower | Loan Amount |
|---|---|---|---|
| Open | Willis Billy E | $193,800 | |
| Previous Owner | Hays Alvy E | $100,000 |
Source: Public Records
Tax History Compared to Growth
Tax History
| Year | Tax Paid | Tax Assessment Tax Assessment Total Assessment is a certain percentage of the fair market value that is determined by local assessors to be the total taxable value of land and additions on the property. | Land | Improvement |
|---|---|---|---|---|
| 2025 | $2,326 | $46,620 | $3,110 | $43,510 |
| 2024 | $2,327 | $46,620 | $3,110 | $43,510 |
| 2023 | $2,327 | $46,620 | $3,110 | $43,510 |
| 2022 | $1,710 | $34,260 | $2,110 | $32,150 |
| 2021 | $1,710 | $34,260 | $2,110 | $32,150 |
| 2020 | $1,710 | $34,260 | $2,110 | $32,150 |
| 2019 | $1,716 | $34,360 | $2,210 | $32,150 |
| 2018 | $1,713 | $34,360 | $2,210 | $32,150 |
| 2017 | $1,556 | $31,190 | $2,220 | $28,970 |
| 2016 | $1,558 | $31,190 | $2,220 | $28,970 |
| 2015 | $1,464 | $31,190 | $2,220 | $28,970 |
| 2014 | $1,463 | $31,190 | $2,220 | $28,970 |
Source: Public Records
Map
Nearby Homes
- 1820 Oak Grove Rd
- 4316 Industrial Park Rd
- 3906 Vinsett Ln E
- TBD Catcher Rd
- 5324 Kibler Rd
- 3716 Wellington Ct
- 5436 Kibler Rd
- 25 Shibley Rd
- TBD Beverly Hills Dr
- 109 S 42nd St
- 2 S 45th St
- 4842 Oak Grove Terrace
- 5109 Grand Meadow Rd
- 631 Mays Branch Rd
- 5208 Grand Juniper Rd
- 3959 Industrial Park Rd
- 6230 Catcher Crossing
- 400 Pleasant Valley Rd
- TBD S 28th St
- 1218 Oak Grove Rd
- 1231 Oak Grove Rd
- 1248 Oak Grove Rd
- 1245 Oak Grove Rd
- 1114 Oak Grove Rd
- 1253 Oak Grove Rd
- 1339 Oak Grove Rd
- 1305 Oak Grove Rd
- 1036 Oak Grove Rd
- 1311 Oak Grove Rd
- 1319 Oak Grove Rd
- 4930 Industrial Park Rd
- 4822 Industrial Park Rd
- 4908 Industrial Park Rd
- 1403 Oak Grove Rd
- 1414 Oak Grove Rd
- 4834 Industrial Park Rd
- 4806 Industrial Park Rd
- 4909 Old Rouw Rd
- 5021 Industrial Park Rd