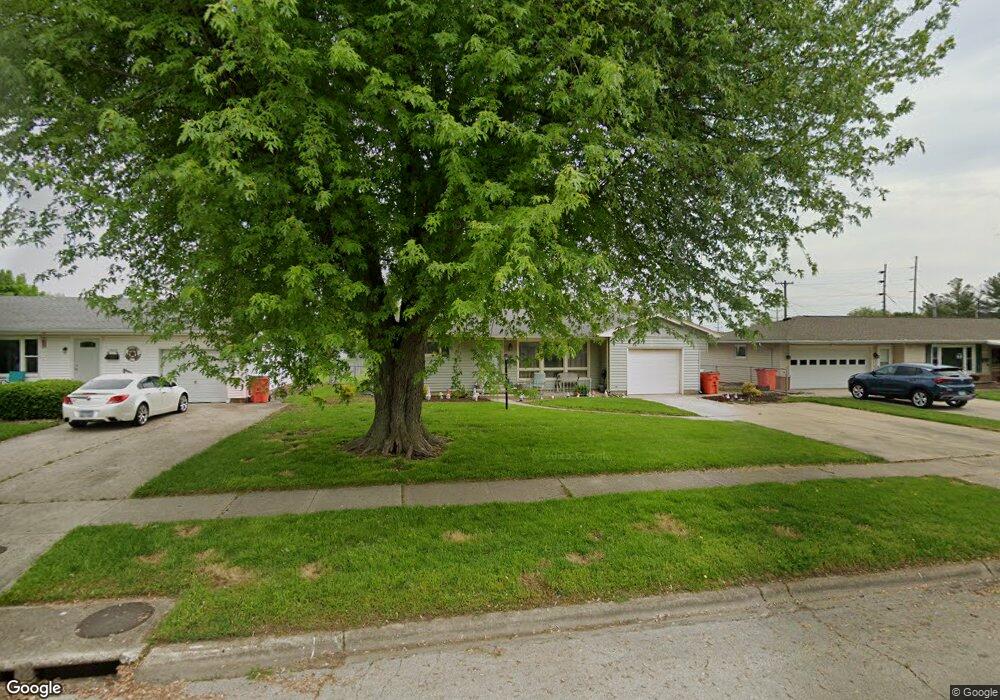
1220 Rudy Ave Mattoon, IL 61938
Estimated Value: $103,068 - $118,000
2
Beds
1
Bath
900
Sq Ft
$126/Sq Ft
Est. Value
About This Home
This home is located at 1220 Rudy Ave, Mattoon, IL 61938 and is currently estimated at $113,767, approximately $126 per square foot. 1220 Rudy Ave is a home located in Coles County with nearby schools including Mattoon High School, St Mary School, and St. John's Lutheran School.
Ownership History
Date
Name
Owned For
Owner Type
Purchase Details
Closed on
Aug 24, 2017
Sold by
Lawhorn Glen D and Lawhorn Dennis E
Bought by
Lawhorn Steven E
Current Estimated Value
Home Financials for this Owner
Home Financials are based on the most recent Mortgage that was taken out on this home.
Original Mortgage
$55,000
Interest Rate
3.93%
Mortgage Type
New Conventional
Purchase Details
Closed on
Feb 8, 2013
Sold by
Lawhorn Steven E and Lawhorn Margaret Irene
Bought by
Lawhorn Glen D and Lawhorn Eula Catherine
Purchase Details
Closed on
Jul 10, 2009
Sold by
Baker Vickie S
Bought by
Lawhorn Chelsey S
Home Financials for this Owner
Home Financials are based on the most recent Mortgage that was taken out on this home.
Original Mortgage
$65,255
Interest Rate
4.94%
Mortgage Type
New Conventional
Create a Home Valuation Report for This Property
The Home Valuation Report is an in-depth analysis detailing your home's value as well as a comparison with similar homes in the area
Home Values in the Area
Average Home Value in this Area
Purchase History
| Date | Buyer | Sale Price | Title Company |
|---|---|---|---|
| Lawhorn Steven E | $65,000 | -- | |
| Lawhorn Glen D | $1,000 | None Available | |
| Lawhorn Steven E | $13,000 | None Available | |
| Lawhorn Chelsey S | $63,000 | None Available |
Source: Public Records
Mortgage History
| Date | Status | Borrower | Loan Amount |
|---|---|---|---|
| Closed | Lawhorn Steven E | $55,000 | |
| Previous Owner | Lawhorn Chelsey S | $65,255 |
Source: Public Records
Tax History Compared to Growth
Tax History
| Year | Tax Paid | Tax Assessment Tax Assessment Total Assessment is a certain percentage of the fair market value that is determined by local assessors to be the total taxable value of land and additions on the property. | Land | Improvement |
|---|---|---|---|---|
| 2024 | $2,515 | $29,596 | $5,641 | $23,955 |
| 2023 | $2,337 | $26,425 | $5,037 | $21,388 |
| 2022 | $2,273 | $25,989 | $4,954 | $21,035 |
| 2021 | $2,279 | $23,871 | $7,622 | $16,249 |
| 2020 | $2,256 | $24,733 | $7,897 | $16,836 |
| 2019 | $2,219 | $23,871 | $7,622 | $16,249 |
| 2018 | $2,182 | $23,871 | $7,622 | $16,249 |
| 2017 | $1,173 | $23,871 | $7,622 | $16,249 |
| 2016 | $1,151 | $23,871 | $7,622 | $16,249 |
| 2015 | $1,577 | $23,871 | $7,622 | $16,249 |
| 2014 | $1,577 | $23,871 | $7,622 | $16,249 |
| 2013 | $1,577 | $23,871 | $7,622 | $16,249 |
Source: Public Records
Map
Nearby Homes
- 1208 S 12th St
- 1017 S 14th St
- 1009 S 14th St
- 1604 S 9th St
- 1821 Dakota Ave
- 1404 S 6th St
- LOT 37 Broadmoor Edgewater
- 1305 Marshall Ave
- 1613 Marshall Ave
- 237 Woodlawn Ave
- 1701 Marshall Ave
- 1100 Marshall Ave
- 705 Marion Ave
- 1616 Marshall Ave
- 307 Illinois Ave
- 217 Woodlawn Ave
- 309 Essex Ave
- 613 S 7th St
- 1509 Lafayette Ave
- 905 S 23rd St