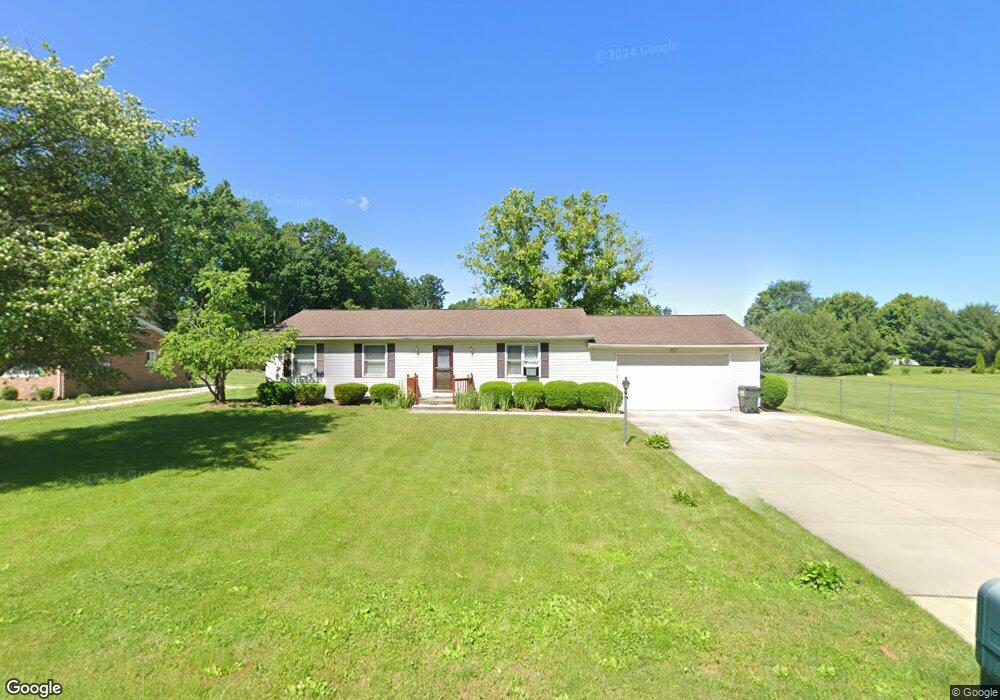
1220 S Diamond St Ravenna, OH 44266
Estimated Value: $200,000 - $218,610
3
Beds
2
Baths
1,344
Sq Ft
$156/Sq Ft
Est. Value
About This Home
This home is located at 1220 S Diamond St, Ravenna, OH 44266 and is currently estimated at $210,153, approximately $156 per square foot. 1220 S Diamond St is a home located in Portage County with nearby schools including Willyard Elementary School, West Park Elementary School, and Brown Middle School.
Ownership History
Date
Name
Owned For
Owner Type
Purchase Details
Closed on
Oct 5, 2007
Sold by
Jones Robert K and Jones Cynthia A
Bought by
Jones Cynthia A
Current Estimated Value
Purchase Details
Closed on
Jun 17, 2005
Sold by
Denison Robert L and Denison Cynthia A
Bought by
Jones Robert K and Jones Cynthia A
Home Financials for this Owner
Home Financials are based on the most recent Mortgage that was taken out on this home.
Original Mortgage
$126,996
Outstanding Balance
$66,555
Interest Rate
5.82%
Mortgage Type
FHA
Estimated Equity
$143,598
Purchase Details
Closed on
May 24, 2004
Sold by
Kelley Paul R
Bought by
Denison Robert L and Denison Cynthia A
Purchase Details
Closed on
Mar 3, 1999
Sold by
Stevenson A S
Bought by
Kelley Paul R and Kelley Dawn K
Home Financials for this Owner
Home Financials are based on the most recent Mortgage that was taken out on this home.
Original Mortgage
$99,200
Interest Rate
12.37%
Purchase Details
Closed on
Oct 7, 1988
Bought by
Kale Robert C
Create a Home Valuation Report for This Property
The Home Valuation Report is an in-depth analysis detailing your home's value as well as a comparison with similar homes in the area
Home Values in the Area
Average Home Value in this Area
Purchase History
| Date | Buyer | Sale Price | Title Company |
|---|---|---|---|
| Jones Cynthia A | -- | Attorney | |
| Jones Robert K | $128,000 | Approved Statewide Title Age | |
| Denison Robert L | $73,200 | -- | |
| Kelley Paul R | $94,900 | -- | |
| Kale Robert C | $64,500 | -- |
Source: Public Records
Mortgage History
| Date | Status | Borrower | Loan Amount |
|---|---|---|---|
| Open | Jones Robert K | $126,996 | |
| Previous Owner | Kelley Paul R | $99,200 | |
| Closed | Kelley Paul R | $1,500 |
Source: Public Records
Tax History Compared to Growth
Tax History
| Year | Tax Paid | Tax Assessment Tax Assessment Total Assessment is a certain percentage of the fair market value that is determined by local assessors to be the total taxable value of land and additions on the property. | Land | Improvement |
|---|---|---|---|---|
| 2024 | $2,236 | $61,430 | $8,230 | $53,200 |
| 2023 | $2,241 | $50,440 | $8,820 | $41,620 |
| 2022 | $2,242 | $50,440 | $8,820 | $41,620 |
| 2021 | $2,245 | $50,440 | $8,820 | $41,620 |
| 2020 | $2,083 | $41,580 | $8,820 | $32,760 |
| 2019 | $2,086 | $41,580 | $8,820 | $32,760 |
| 2018 | $2,002 | $37,730 | $8,820 | $28,910 |
| 2017 | $2,002 | $37,730 | $8,820 | $28,910 |
| 2016 | $1,882 | $37,730 | $8,820 | $28,910 |
| 2015 | $1,884 | $37,730 | $8,820 | $28,910 |
| 2014 | $1,976 | $37,730 | $8,820 | $28,910 |
| 2013 | $1,870 | $37,730 | $8,820 | $28,910 |
Source: Public Records
Map
Nearby Homes
- 1226 S Diamond St
- 870 Susan Rd
- 655 Ellen Ct
- 1056 Sunnywood Ln
- 1257 Shadowlawn Dr
- 668 Westbrook Ct
- 1006 Brittingham Dr
- 5370 Winding Creek Dr
- 4165 Timber Run
- 3366 Hommon Rd
- 452 Mill Rd
- 1024 W Riddle Ave
- 1057 W Riddle Ave
- 453 S Chestnut St
- 159 E Harris Ave
- 247 King St
- 3174 Wolf Run Unit 2
- 3159 Pondview Dr Unit 7
- 208 King St
- 856 W Main St
- 841 Susan Rd
- 845 Susan Rd
- 1217 S Diamond St
- 1214 S Diamond St
- 1221 S Diamond St
- 1225 S Diamond St
- 840 Susan Rd
- 1213 S Diamond St
- 1229 S Diamond St
- 3775 Longfield Rd
- 3763 Longfield Rd
- 1209 S Diamond St
- 1233 S Diamond St
- 851 Susan Rd
- 1237 S Diamond St
- 1205 S Diamond St
- 854 Susan Rd
- 667 Northwood Ct
- 1241 S Diamond St
- 3749 Longfield Rd