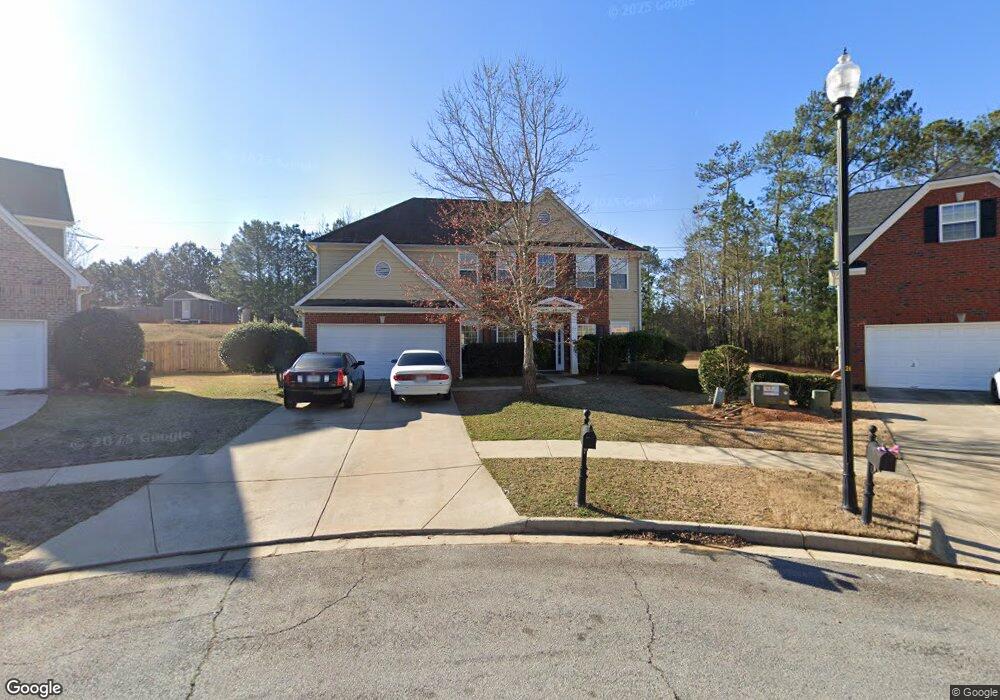
1220 Shelborne Way Locust Grove, GA 30248
Estimated Value: $348,098 - $415,000
4
Beds
3
Baths
2,787
Sq Ft
$132/Sq Ft
Est. Value
About This Home
This home is located at 1220 Shelborne Way, Locust Grove, GA 30248 and is currently estimated at $368,525, approximately $132 per square foot. 1220 Shelborne Way is a home located in Henry County with nearby schools including Bethlehem Elementary School, Luella Middle School, and Luella High School.
Ownership History
Date
Name
Owned For
Owner Type
Purchase Details
Closed on
Jun 8, 2018
Sold by
Patharwala Sajid
Bought by
Patharwala Sajid and Ayani Momin
Current Estimated Value
Purchase Details
Closed on
Aug 31, 2010
Sold by
Federal Home Loan Mortgage Corporation
Bought by
Hill Chanda D
Home Financials for this Owner
Home Financials are based on the most recent Mortgage that was taken out on this home.
Original Mortgage
$127,301
Interest Rate
5.12%
Mortgage Type
FHA
Purchase Details
Closed on
Jun 1, 2010
Sold by
Navy Fcu
Bought by
Federal Home Loan Mortgage Corporation
Purchase Details
Closed on
Dec 27, 2005
Sold by
Mccar Homes Inc
Bought by
Gomez Hector I
Home Financials for this Owner
Home Financials are based on the most recent Mortgage that was taken out on this home.
Original Mortgage
$200,000
Interest Rate
6.19%
Mortgage Type
New Conventional
Create a Home Valuation Report for This Property
The Home Valuation Report is an in-depth analysis detailing your home's value as well as a comparison with similar homes in the area
Home Values in the Area
Average Home Value in this Area
Purchase History
| Date | Buyer | Sale Price | Title Company |
|---|---|---|---|
| Patharwala Sajid | -- | -- | |
| Patharwala Sajid | $150,000 | -- | |
| Hill Chanda D | -- | -- | |
| Federal Home Loan Mortgage Corporation | -- | -- | |
| Navy Fcu | $169,000 | -- | |
| Gomez Hector I | $233,500 | -- |
Source: Public Records
Mortgage History
| Date | Status | Borrower | Loan Amount |
|---|---|---|---|
| Previous Owner | Hill Chanda D | $127,301 | |
| Previous Owner | Gomez Hector I | $200,000 |
Source: Public Records
Tax History Compared to Growth
Tax History
| Year | Tax Paid | Tax Assessment Tax Assessment Total Assessment is a certain percentage of the fair market value that is determined by local assessors to be the total taxable value of land and additions on the property. | Land | Improvement |
|---|---|---|---|---|
| 2025 | $5,818 | $144,520 | $16,000 | $128,520 |
| 2024 | $5,818 | $122,560 | $14,000 | $108,560 |
| 2023 | $4,806 | $122,560 | $14,000 | $108,560 |
| 2022 | $4,806 | $122,560 | $14,000 | $108,560 |
| 2021 | $2,406 | $60,000 | $7,020 | $52,980 |
| 2020 | $2,406 | $60,000 | $7,020 | $52,980 |
| 2019 | $2,061 | $60,000 | $7,020 | $52,980 |
| 2018 | $0 | $81,760 | $10,000 | $71,760 |
| 2016 | $2,725 | $68,320 | $10,000 | $58,320 |
| 2015 | $2,800 | $68,160 | $10,000 | $58,160 |
| 2014 | $2,650 | $63,600 | $10,000 | $53,600 |
Source: Public Records
Map
Nearby Homes
- 1429 Kentmire Ct
- 112 Leveret Rd
- 2439 Mcintosh Dr
- 1171 Bodega Loop
- 5001 Wolverine Place
- 1913 Avondale Ct
- 2356 Mcintosh Dr
- 2336 Mcintosh Dr
- 250 High Court Way
- 412 Eglington Trail
- 512 Vickers Ln
- 1496 Trestle Rd
- 358 Southgate Dr
- 271 Trestle Rd
- 150 Cottage Club Dr
- 156 Cottage Club Dr
- 411 Johnson
- 214 Georgian Way
- 119 Bantry Way
- 164 Cottage Club Dr
- 1217 Shelborne Way
- 1216 Shelborne Way
- 1213 Shelborne Way
- 1064 Buckhorn Bend
- 1212 Shelborne Way
- 1068 Buckhorn Bend
- 1209 Shelbourne Way
- 1208 Shelborne Way
- 1209 Shelborne Way
- 837 Brampton Way
- 1060 Buckhorn Bend
- 833 Brampton Way
- 841 Brampton Way
- 1205 Shelborne Way
- 1204 Shelborne Way
- 829 Brampton Way
- 845 Brampton Way
- 1071 Buckhorn Bend
- 992 Buckhorn Bend
- 825 Brampton Way