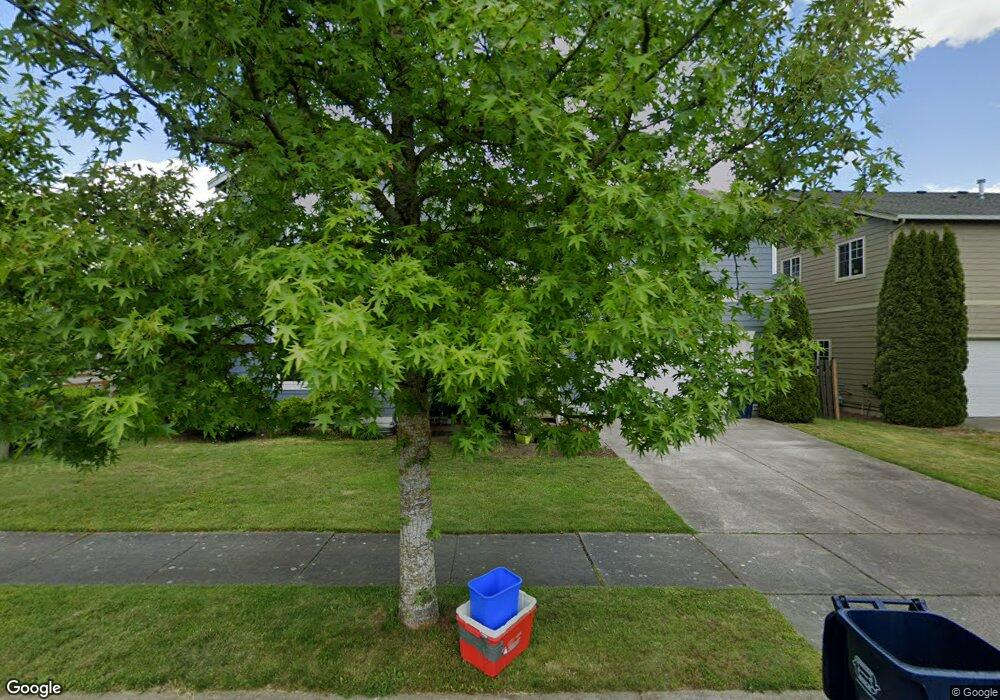
1220 Spruce Cir Unit A Lynden, WA 98264
Estimated Value: $482,000 - $514,003
3
Beds
3
Baths
1,874
Sq Ft
$269/Sq Ft
Est. Value
About This Home
This home is located at 1220 Spruce Cir Unit A, Lynden, WA 98264 and is currently estimated at $503,251, approximately $268 per square foot. 1220 Spruce Cir Unit A is a home located in Whatcom County with nearby schools including Lynden High School, Lynden Christian School, and Cornerstone Christian School.
Ownership History
Date
Name
Owned For
Owner Type
Purchase Details
Closed on
Oct 21, 2020
Sold by
Dotinga Charrice
Bought by
Morrow Darci K and Morrow Raymond Joseph
Current Estimated Value
Home Financials for this Owner
Home Financials are based on the most recent Mortgage that was taken out on this home.
Original Mortgage
$322,050
Outstanding Balance
$285,924
Interest Rate
2.8%
Mortgage Type
New Conventional
Estimated Equity
$217,327
Purchase Details
Closed on
Dec 22, 2006
Sold by
Homestar Northwest Llc
Bought by
Gordon Donna
Home Financials for this Owner
Home Financials are based on the most recent Mortgage that was taken out on this home.
Original Mortgage
$215,780
Interest Rate
6.22%
Mortgage Type
Purchase Money Mortgage
Create a Home Valuation Report for This Property
The Home Valuation Report is an in-depth analysis detailing your home's value as well as a comparison with similar homes in the area
Home Values in the Area
Average Home Value in this Area
Purchase History
| Date | Buyer | Sale Price | Title Company |
|---|---|---|---|
| Morrow Darci K | $339,000 | Whatcom Land Title | |
| Morrow Darci K | $5,429,000 | Whatcom Land Title | |
| Morrow Darci K | $339,000 | Whatcom Land Title Co Inc | |
| Gordon Donna | $270,015 | Whatcom Land Title |
Source: Public Records
Mortgage History
| Date | Status | Borrower | Loan Amount |
|---|---|---|---|
| Open | Morrow Darci K | $322,050 | |
| Closed | Morrow Darci K | $322,050 | |
| Previous Owner | Gordon Donna | $215,780 |
Source: Public Records
Tax History Compared to Growth
Tax History
| Year | Tax Paid | Tax Assessment Tax Assessment Total Assessment is a certain percentage of the fair market value that is determined by local assessors to be the total taxable value of land and additions on the property. | Land | Improvement |
|---|---|---|---|---|
| 2024 | $3,401 | $472,690 | $50,000 | $422,690 |
| 2023 | $3,401 | $472,690 | $50,000 | $422,690 |
| 2022 | $3,112 | $381,128 | $58,902 | $322,226 |
| 2021 | $3,108 | $337,282 | $52,125 | $285,157 |
| 2020 | $2,814 | $306,614 | $47,386 | $259,228 |
| 2019 | $2,496 | $290,620 | $44,914 | $245,706 |
| 2018 | $2,616 | $264,220 | $40,834 | $223,386 |
| 2017 | $2,106 | $227,480 | $35,156 | $192,324 |
| 2016 | $2,046 | $194,681 | $32,220 | $162,461 |
| 2015 | $1,744 | $188,126 | $30,960 | $157,166 |
| 2014 | -- | $174,731 | $28,770 | $145,961 |
| 2013 | -- | $172,773 | $28,500 | $144,273 |
Source: Public Records
Map
Nearby Homes
- 2205 Dejong Dr
- 2201 Dejong Dr
- 8885 Line Rd
- 1660 Eastwood Way
- 1725 Aaron Dr
- 2202 Berryman Loop
- 1136 N Cascade Ct
- 1112 N Cascade Ct
- 1402 Bradley Meadows Ln
- 1319 Bradley Ct
- 1251 Garden Cir
- 9586 Bender Rd
- 8639 Bender Rd
- 114 Twin Sister Loop
- 1340 Kamm Rd
- 2021 Brome St
- 1792 Bradley Rd
- 2029 Brome St
- 1178 E Grover St Unit 101
- 8865 Northwood Rd
- 1220 Spruce Cir Unit B
- 1208 Spruce Cir
- 2229 Cherry St Unit 12B
- 1223 Spruce Cir Unit 1A
- 1223 Spruce Cir Unit B
- 1223 Spruce Cir Unit A
- 1277 Aaron Dr
- 1239 Spruce Cir Unit A
- 1239 Spruce Cir Unit B
- 1231 Spruce Cir Unit B
- 1231 Spruce Cir Unit A
- 1247 Spruce Cir Unit A
- 1247 Spruce Cir Unit B
- 2277 Cherry St Unit 11B
- 1255 Spruce Cir Unit B
- 1255 Spruce Cir Unit A
- 1255 Spruce Cir Unit 5B
- 1255 Spruce Cir Unit 5A
- 1252 Spruce Cir Unit B
- 1252 Spruce Cir Unit A