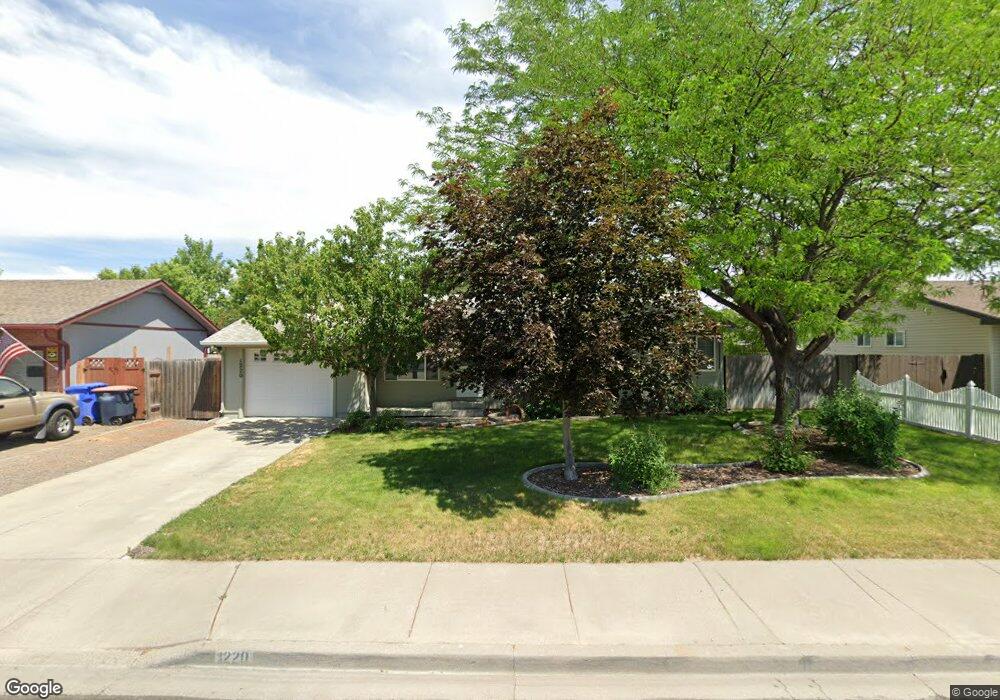
1220 Starfire St Twin Falls, ID 83301
Estimated Value: $303,000 - $341,000
3
Beds
3
Baths
1,358
Sq Ft
$235/Sq Ft
Est. Value
About This Home
This home is located at 1220 Starfire St, Twin Falls, ID 83301 and is currently estimated at $318,828, approximately $234 per square foot. 1220 Starfire St is a home located in Twin Falls County with nearby schools including I.B. Perrine Elementary School, Robert Stuart Junior High School, and Canyon Ridge High School.
Ownership History
Date
Name
Owned For
Owner Type
Purchase Details
Closed on
Jul 14, 2023
Sold by
Mendonca Arnold T and Mendonca Danielle R
Bought by
Mendonca Arnold T
Current Estimated Value
Purchase Details
Closed on
Jul 11, 2023
Sold by
Mendonca Arnold T
Bought by
Mendonca Arnold T and Mendonca Danielle R
Purchase Details
Closed on
May 7, 2018
Sold by
Wolters Sherry Liane
Bought by
Mendonca Arnold T
Purchase Details
Closed on
Apr 15, 2009
Sold by
Mendonca Arnold T
Bought by
Layne Sherry
Purchase Details
Closed on
Jan 18, 2007
Sold by
Cammack Ray E
Bought by
Mendonca Arnold T
Purchase Details
Closed on
Jan 13, 2006
Sold by
Cammack Ray E and Cammack Victoria L
Bought by
Cammack Ray E
Home Financials for this Owner
Home Financials are based on the most recent Mortgage that was taken out on this home.
Original Mortgage
$23,500
Interest Rate
6.18%
Mortgage Type
Stand Alone Second
Create a Home Valuation Report for This Property
The Home Valuation Report is an in-depth analysis detailing your home's value as well as a comparison with similar homes in the area
Home Values in the Area
Average Home Value in this Area
Purchase History
| Date | Buyer | Sale Price | Title Company |
|---|---|---|---|
| Mendonca Arnold T | -- | None Listed On Document | |
| Mendonca Arnold T | -- | None Listed On Document | |
| Mendonca Arnold T | -- | First American Title | |
| Mendonca Arnold T | -- | First American Title | |
| Layne Sherry | -- | -- | |
| Mendonca Arnold T | -- | Alliance Title | |
| Cammack Ray E | -- | -- |
Source: Public Records
Mortgage History
| Date | Status | Borrower | Loan Amount |
|---|---|---|---|
| Previous Owner | Cammack Ray E | $23,500 |
Source: Public Records
Tax History Compared to Growth
Tax History
| Year | Tax Paid | Tax Assessment Tax Assessment Total Assessment is a certain percentage of the fair market value that is determined by local assessors to be the total taxable value of land and additions on the property. | Land | Improvement |
|---|---|---|---|---|
| 2024 | $1,204 | $252,439 | $63,983 | $188,456 |
| 2023 | $1,160 | $265,339 | $63,983 | $201,356 |
| 2022 | $1,589 | $263,760 | $57,949 | $205,811 |
| 2021 | $1,523 | $202,297 | $45,904 | $156,393 |
| 2020 | $1,214 | $159,180 | $38,276 | $120,904 |
| 2019 | $1,403 | $157,059 | $38,276 | $118,783 |
| 2018 | $2,686 | $143,421 | $30,781 | $112,640 |
| 2017 | $2,409 | $128,483 | $30,781 | $97,702 |
| 2016 | $2,269 | $113,191 | $0 | $0 |
| 2015 | $2,208 | $113,191 | $30,781 | $82,410 |
| 2012 | -- | $102,993 | $0 | $0 |
Source: Public Records
Map
Nearby Homes
- 1230 Blake St N
- 1148 Blake St N
- 1039 Blake St N
- 329 Falls Ave W
- 1434 Tara St
- 551 Park Meadows Cir
- 1108 Twin Parks Dr
- 167 Robbins Ave
- 145 Robbins Ave
- 145, 147, 149 Robbins St
- 1494 Northern Pine Dr
- 147 Robbins Ave
- 797-3-1 Meadows Dr
- 149 Robbins Ave
- 833 Monroe St
- 905 Birchton Loop
- 874 Eastwind Dr
- 790 Academic Dr
- 748 Meadows Dr
- 281 Caswell Ave W Unit A-10
- 1210 Starfire St
- 1211 Starfire St
- 1202 Starfire St
- 1221 Starfire St
- 1221 Monaco St
- 1231 Monaco St
- 1211 Monaco St
- 252 Northstar and 1201 Starfire
- 1231 Starfire St
- 1240 Starfire St
- 204 Northstar Ave
- 252 Northstar Ave
- 1201 Starfire St
- 1241 Monaco St
- 1241 Starfire St
- 1220 Blake St N
- 227 Northstar Ave
- 1250 Starfire St
- 1210 Monaco St
- 203 Northstar Ave