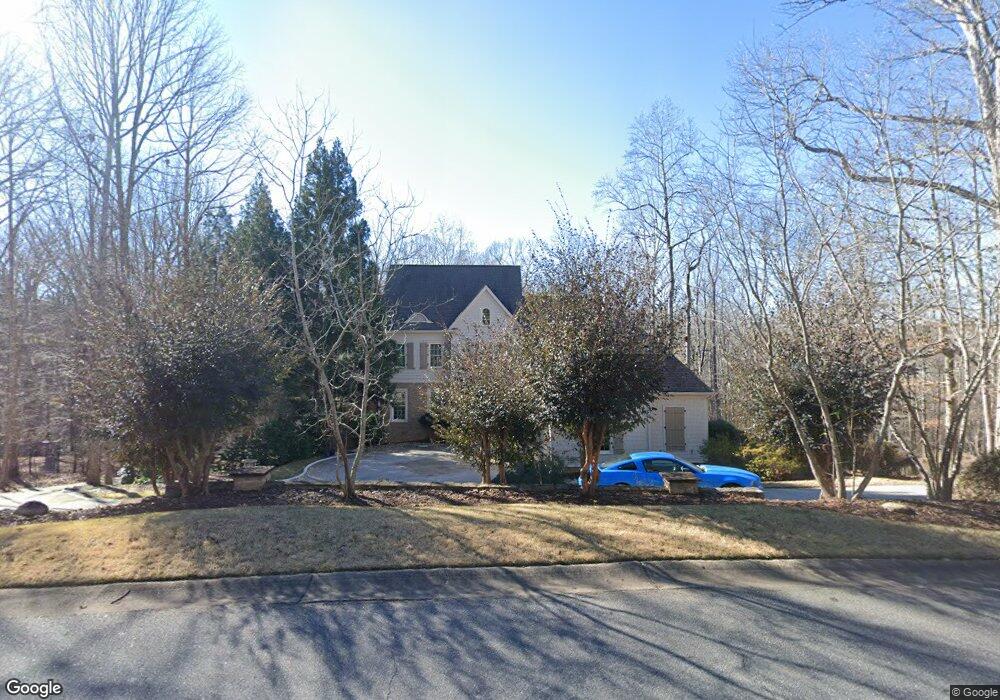
1220 Tanglebrook Dr Athens, GA 30606
Skyline NeighborhoodEstimated Value: $792,000 - $1,365,000
5
Beds
5
Baths
3,815
Sq Ft
$255/Sq Ft
Est. Value
About This Home
This home is located at 1220 Tanglebrook Dr, Athens, GA 30606 and is currently estimated at $971,120, approximately $254 per square foot. 1220 Tanglebrook Dr is a home located in Oconee County with nearby schools including Oconee County Primary School, Oconee County Elementary School, and Malcom Bridge Middle School.
Ownership History
Date
Name
Owned For
Owner Type
Purchase Details
Closed on
Mar 16, 2015
Sold by
Anderson Jonathan M
Bought by
Anderson Jonthan M and Anderson Melissa M
Current Estimated Value
Home Financials for this Owner
Home Financials are based on the most recent Mortgage that was taken out on this home.
Original Mortgage
$311,000
Outstanding Balance
$107,173
Interest Rate
3.89%
Mortgage Type
New Conventional
Estimated Equity
$863,947
Purchase Details
Closed on
Jan 19, 2007
Sold by
Not Provided
Bought by
Anderson Jonathan M
Home Financials for this Owner
Home Financials are based on the most recent Mortgage that was taken out on this home.
Original Mortgage
$665,000
Interest Rate
6.07%
Mortgage Type
New Conventional
Purchase Details
Closed on
May 16, 1995
Bought by
Roper Roper J and Roper Sam
Create a Home Valuation Report for This Property
The Home Valuation Report is an in-depth analysis detailing your home's value as well as a comparison with similar homes in the area
Home Values in the Area
Average Home Value in this Area
Purchase History
| Date | Buyer | Sale Price | Title Company |
|---|---|---|---|
| Anderson Jonthan M | -- | -- | |
| Anderson Jonathan M | -- | -- | |
| Anderson Jonathan M | $865,000 | -- | |
| Anderson Jonathan M | $135,000 | -- | |
| Roper Roper J | $32,000 | -- |
Source: Public Records
Mortgage History
| Date | Status | Borrower | Loan Amount |
|---|---|---|---|
| Open | Anderson Jonthan M | $311,000 | |
| Previous Owner | Anderson Jonathan M | $665,000 |
Source: Public Records
Tax History
| Year | Tax Paid | Tax Assessment Tax Assessment Total Assessment is a certain percentage of the fair market value that is determined by local assessors to be the total taxable value of land and additions on the property. | Land | Improvement |
|---|---|---|---|---|
| 2025 | $6,694 | $410,531 | $40,000 | $370,531 |
| 2024 | $6,694 | $376,128 | $37,800 | $338,328 |
| 2023 | $7,053 | $360,604 | $37,800 | $322,804 |
| 2022 | $6,840 | $317,935 | $37,800 | $280,135 |
| 2021 | $6,830 | $294,332 | $37,800 | $256,532 |
| 2020 | $6,748 | $290,357 | $37,800 | $252,557 |
| 2019 | $6,474 | $278,540 | $37,800 | $240,740 |
| 2018 | $7,635 | $321,710 | $37,800 | $283,910 |
| 2017 | $7,635 | $321,710 | $37,800 | $283,910 |
| 2016 | $7,628 | $321,410 | $37,800 | $283,610 |
| 2015 | $7,587 | $319,132 | $37,800 | $281,332 |
| 2014 | $6,926 | $284,710 | $37,800 | $246,910 |
| 2013 | -- | $303,093 | $42,000 | $261,093 |
Source: Public Records
Map
Nearby Homes
- 155 Ridgeview Dr
- 301 Skyline Pkwy
- 1340 Old Epps Bridge Rd
- 200 Skyline Pkwy
- 199 Tanglewood Dr
- 220 Tanglewood Dr
- 157 Holly Hills Ct
- 137 Timothy Park Ln
- 381 Township Ln
- 173 Timothy Park Ln
- 1720 Timothy Rd
- 130 Wexford Place
- 237 Towns Walk Dr
- 190 Kirkwood Dr
- 236 Towns Walk Dr
- 199 Lenox Place
- 1705 Timothy Rd
- 645 Parrish Pointe Dr
- 1847 Olympus Ct
- 1845 Olympus Ct
- 1200 Tanglebrook Dr
- 1240 Tanglebrook Dr
- 1221 Tanglebrook Dr
- 1190 Tanglebrook Dr
- 1041 Maple Ct
- 1181 Tanglebrook Dr
- 1110 Laurel Place
- 1280 Tanglebrook Dr
- 1180 Tanglebrook Dr
- 1050 Tangle Ct
- 1040 Maple Ct
- 1111 Laurel Place
- 1261 Tanglebrook Dr
- 1056 Tangle Ct
- 1320 Tanglebrook Dr
- 1130 Tanglebrook Dr
- 1021 Maple Ct
- 1101 Laurel Place
- 1160 Tangle Dr
- 235 Ridgeview Dr
Your Personal Tour Guide
Ask me questions while you tour the home.