1220 Walnut Ridge Unit L26 Ellijay, GA 30536
Estimated Value: $591,000 - $696,000
3
Beds
4
Baths
2,640
Sq Ft
$252/Sq Ft
Est. Value
About This Home
This home is located at 1220 Walnut Ridge Unit L26, Ellijay, GA 30536 and is currently estimated at $665,313, approximately $252 per square foot. 1220 Walnut Ridge Unit L26 is a home located in Gilmer County with nearby schools including Ellijay Elementary School, Clear Creek Elementary School, and Clear Creek Middle School.
Ownership History
Date
Name
Owned For
Owner Type
Purchase Details
Closed on
Dec 29, 2023
Sold by
Darnell Lonnie K
Bought by
C & M Realty Llc
Current Estimated Value
Purchase Details
Closed on
Sep 30, 2008
Sold by
Bennett Joseph U
Bought by
Darnell Lonnie K
Home Financials for this Owner
Home Financials are based on the most recent Mortgage that was taken out on this home.
Original Mortgage
$139,500
Interest Rate
6.34%
Mortgage Type
New Conventional
Purchase Details
Closed on
Nov 13, 2003
Sold by
Bennett Marian J
Bought by
Bennett Joseph U
Purchase Details
Closed on
Sep 1, 1988
Bought by
Bennett Marian J
Purchase Details
Closed on
Nov 1, 1982
Bought by
Bennett Marian J
Purchase Details
Closed on
Jun 1, 1978
Bought by
Bennett Marian J
Purchase Details
Closed on
Jan 1, 1977
Bought by
Bennett Marian J
Create a Home Valuation Report for This Property
The Home Valuation Report is an in-depth analysis detailing your home's value as well as a comparison with similar homes in the area
Home Values in the Area
Average Home Value in this Area
Purchase History
| Date | Buyer | Sale Price | Title Company |
|---|---|---|---|
| C & M Realty Llc | $231,000 | -- | |
| Darnell Lonnie K | $155,000 | -- | |
| Bennett Joseph U | -- | -- | |
| Bennett Marian J | -- | -- | |
| Bennett Marian J | -- | -- | |
| Bennett Marian J | -- | -- | |
| Bennett Marian J | -- | -- |
Source: Public Records
Mortgage History
| Date | Status | Borrower | Loan Amount |
|---|---|---|---|
| Previous Owner | Darnell Lonnie K | $139,500 |
Source: Public Records
Tax History Compared to Growth
Tax History
| Year | Tax Paid | Tax Assessment Tax Assessment Total Assessment is a certain percentage of the fair market value that is determined by local assessors to be the total taxable value of land and additions on the property. | Land | Improvement |
|---|---|---|---|---|
| 2025 | $2,319 | $157,680 | $15,200 | $142,480 |
| 2024 | $2,319 | $149,640 | $14,400 | $135,240 |
| 2023 | $2,608 | $163,040 | $22,000 | $141,040 |
| 2022 | $2,384 | $135,480 | $20,000 | $115,480 |
| 2021 | $2,090 | $105,320 | $16,000 | $89,320 |
| 2020 | $2,060 | $93,640 | $16,000 | $77,640 |
| 2019 | $1,806 | $79,760 | $9,000 | $70,760 |
| 2018 | $1,642 | $71,560 | $9,000 | $62,560 |
| 2017 | $1,863 | $75,720 | $9,000 | $66,720 |
| 2016 | $1,756 | $69,960 | $7,480 | $62,480 |
| 2015 | $1,457 | $59,080 | $10,400 | $48,680 |
| 2014 | $1,617 | $63,120 | $13,000 | $50,120 |
| 2013 | -- | $64,080 | $13,000 | $51,080 |
Source: Public Records
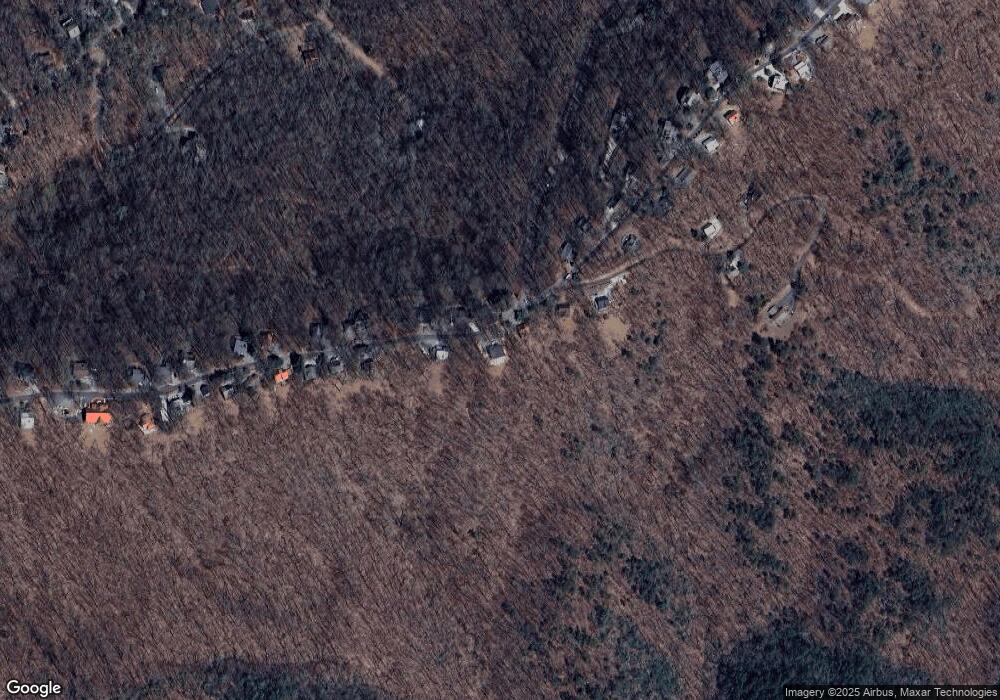
Map
Nearby Homes
- 1225 Walnut Ridge
- 1189 Walnut Ridge Unit 4044
- 1285 Walnut Ridge
- 87 Owltown Dr
- 87 Owltown Dr Unit L40
- LT M214 Walnut Ridge
- M213 Walnut Ridge
- M213 Walnut Ridge Unit M213
- LT M214 Walnut Ridge Unit M214
- 211 Sleepy Hollow Rd
- 99 Sleepy Hollow Rd Unit M99
- 99 Sleepy Hollow Rd
- 0.68 Valley View Rd
- 296 Valley View Rd
- 0 Valley View Rd Unit 7589418
- 0.68 Valley View
- J214 Walnut Mountain Rd
- J-214 Walnut Mountain Rd
- 1665 Walnut Ridge
- 341 Valley View Rd
- 1220 Walnut Ridge
- 1228 Walnut Ridge
- 1228 Walnut Ridge Unit L27
- 1186 Walnut Ridge
- 1246 Walnut Ridge
- 1246 Walnut Ridge Unit 28-29
- 1173 Walnut Ridge
- 1265 Walnut Ridge
- 31 Owltown Dr
- 32 Owltown Dr
- 1142 Walnut Ridge
- 1145 Walnut Ridge
- 1284 Walnut Ridge
- 1284 Walnut Ridge Unit L-42
- 1309 Walnut Ridge
- 1118 Walnut Ridge
- 1106 Walnut Ridge Unit 4230
- 1117 Walnut Ridge Unit 4142
- L 38 Owltown Dr
- E Owltown Dr